Construct a Global Data Grid
Imagine an extremely coarse map of the world in which each cell represents 60°. Such a map matrix would be 3-by-6.
Create a 3-by-6 grid:
miniZ = [1 2 3 4 5 6; 7 8 9 10 11 12; 13 14 15 16 17 18];
Now make a referencing object:
miniR = georasterref('RasterSize', size(miniZ), ...
   'Latlim', [-90 90], 'Lonlim', [-180 180])
Your output appears like this:
miniR =

  GeographicCellsReference with properties:

             LatitudeLimits: [-90 90]
            LongitudeLimits: [-180 180]
                 RasterSize: [3 6]
       RasterInterpretation: 'cells'
           ColumnsStartFrom: 'south'
              RowsStartFrom: 'west'
       CellExtentInLatitude: 60
      CellExtentInLongitude: 60
     RasterExtentInLatitude: 180
    RasterExtentInLongitude: 360
           XIntrinsicLimits: [0.5 6.5]
           YIntrinsicLimits: [0.5 3.5]
       CoordinateSystemType: 'geographic'
                  AngleUnit: 'degree'
Set up an equidistant cylindrical map projection:
figure('Color','white')
ax = axesm('MapProjection', 'eqdcylin');
axis off
setm(ax,'GLineStyle','-', 'Grid','on','Frame','on')
Draw a graticule with parallel and meridian labels at 60° intervals:
setm(ax, 'MlabelLocation', 60, 'PlabelLocation',[-30 30],...
    'MLabelParallel','north', 'MeridianLabel','on',...
    'ParallelLabel','on','MlineLocation',60,...
    'PlineLocation',[-30 30])
Map the data using
geoshowand display with a color ramp and legend:geoshow(miniZ, miniR, 'DisplayType', 'texturemap'); colormap('autumn') colorbar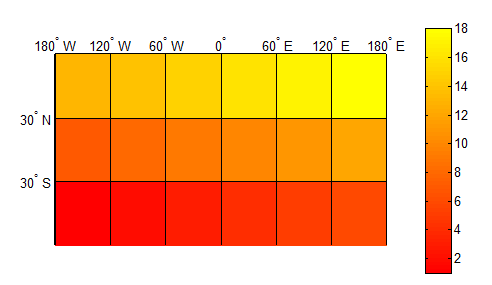
Note that the first row of the matrix is displayed at the bottom of the map, while the last row is displayed at the top.