Geographic Interpretations of Geolocated Grids
Mapping Toolbox™ software supports three different interpretations of geolocated data grids:
First, a map matrix having the same number of rows and columns as the latitude and longitude coordinate matrices represents the values of the map data at the corresponding geographic points (centers of data cells).
Next, a map matrix having one fewer row and one fewer column than the geographic coordinate matrices represents the values of the map data within the area formed by the four adjacent latitudes and longitudes.
Finally, if the latitude and longitude matrices have smaller dimensions than the map matrix, you can interpret them as describing a coarser graticule, or mesh of latitude and longitude cells, into which the blocks of map data are warped.
This section discusses the first two interpretations of geolocated data grids. For more information on the use of graticules, see Map Grid.
Type 1: Values Associated with the Upper Left Grid Coordinate
As an example of the first interpretation, consider a 4-by-4 map matrix whose cell size is 30-by-30 degrees, along with its corresponding 4-by-4 latitude and longitude matrices:
Z = [ ...
 1  2  3  4; ...
 5  6  7  8; ...
 9 10 11 12; ...
13 14 15 16];

lat = [ ...
  30  30  30  30; ...
   0   0   0   0; ...
 -30 -30 -30 -30; ...
 -60 -60 -60 -60];

lon = [ ...
 0 30 60 90;...
 0 30 60 90;...
 0 30 60 90;...
 0 30 60 90];
Display the geolocated data grid with the values of map shown
at the associated latitudes and longitudes:
figure('Color','white','Colormap',autumn(64))
axesm('pcarree','Grid','on','Frame','on',...
    'PLineLocation',30,'PLabelLocation',30)
mlabel; plabel; axis off; tightmap

h = geoshow(lat,lon,Z,'DisplayType','surface');
set(h,'ZData',zeros(size(Z)))
ht = textm(lat(:),lon(:),num2str(Z(:)), ...
    'Color','blue','FontSize',14);

colorbar('southoutside')
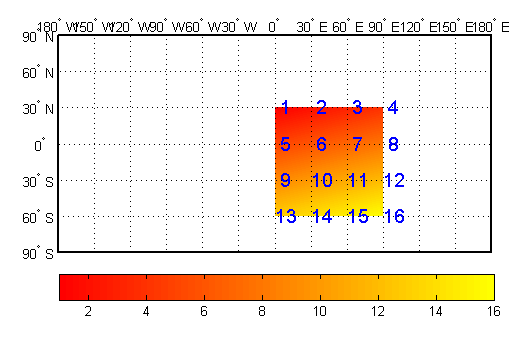
Notice that only 9 of the 16 total cells are displayed. The value displayed for
each cell is the value at the upper left corner of that cell, whose coordinates are
given by the corresponding lat and lon
elements. By convention, the last row and column of the map matrix are not
displayed, although they exist in the CData property of the
surface object.
Type 2: Values Centered Within Four Adjacent Coordinates
For the second interpretation, consider a 3-by-3 map matrix with the same
lat and lon variables:
delete(h)
delete(ht)

Z3by3 = [ ...
 1  2  3; ...
 4  5  6; ...
 7  8  9];

h = geoshow(lat,lon,Z3by3,'DisplayType','texturemap');

tlat = [ ...
   15 15 15; ...
   -15 -15 -15; ...
   -45 -45 -45];

tlon = [ ...
    15 45 75; ...
    15 45 75; ...
    15 45 74];

textm(tlat(:),tlon(:),num2str(Z3by3(:)), ...
    'Color','blue','FontSize',14)
Display a surface plot of the map matrix, with the values of
map shown at the center of the associated cells:
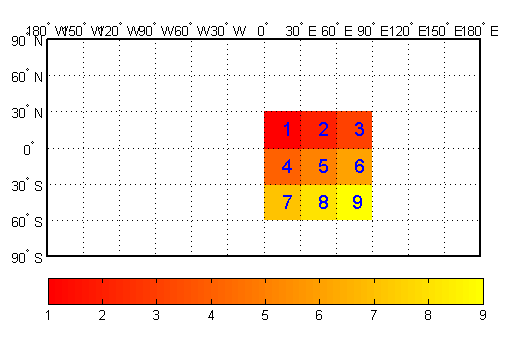
All the map data is displayed for this geolocated data grid. The value of each cell is the value at the center of the cell, and the latitudes and longitudes in the coordinate matrices are the boundaries for the cells.
Ordering of Cells
You may have noticed that the first row of the matrix is displayed as the top of
the map, whereas for a regular data grid, the opposite was true: the first row
corresponded to the bottom of the map. This difference is entirely due to how the
lat and lon matrices are ordered. In a
geolocated data grid, the order of values in the two coordinate matrices determines
the arrangement of the displayed values.
Transform Regular to Geolocated Grids
When required, you can transform a regular data grid into a geolocated data grid
by using the geographicGrid function.
Transforming Geolocated to Regular Grids
Conversely, a regular data grid can also be constructed from a geolocated data
grid. The coordinates and values can be embedded in a new regular data grid.
Depending on your data, there are multiple ways to create a regular data grid from a
geolocated data grid. For more information, see geoloc2grid, Reference Regularly Spaced Raster Data Using Coordinates, and Reference Scattered Raster Data Using Interpolation.