向地形图添加光源
R2026b为科罗拉多州南博尔德峰周边地区的地形图添加一个光源。
首先,导入高程数据和一个地理坐标参考对象。若要使用 geoshow 绘制数据,栅格数据必须为 double 或 single 类型。因此,请使用 'OutputType' 名称-值对指定栅格的数据类型。
[Z,R] = readgeoraster('n39_w106_3arc_v2.dt1','OutputType','double');
然后,将数据以曲面形式显示出来。使用 demcmap 函数为地形数据应用合适的颜色图。
usamap(R.LatitudeLimits,R.LongitudeLimits);
geoshow(Z,R,'DisplayType','surface')
demcmap(Z)
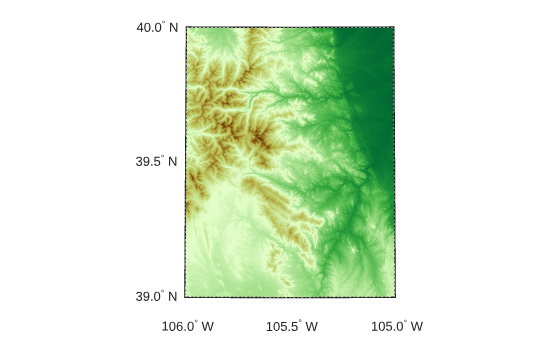
使用 daspectm 函数设置垂直夸大倍数。然后,在地图的左上角指定一个光源。通过查询引用对象的 LatitudeLimits 和 LongitudeLimits 属性,获取左上角的坐标。
daspectm('m',20)
cornerlat = R.LatitudeLimits(2);
cornerlon = R.LongitudeLimits(1);
lightm(cornerlat,cornerlon)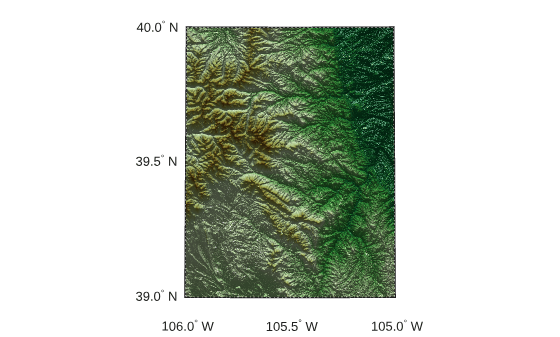
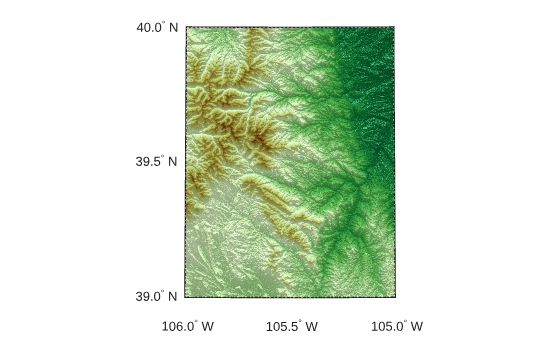
通过指定环境光、漫反射光和镜面反射光的强度,恢复地图的亮度。
ambient = 0.7;
diffuse = 1;
specular = 0.6;
material([ambient diffuse specular])
本示例中使用的 DTED 文件由美国地质调查局提供。

