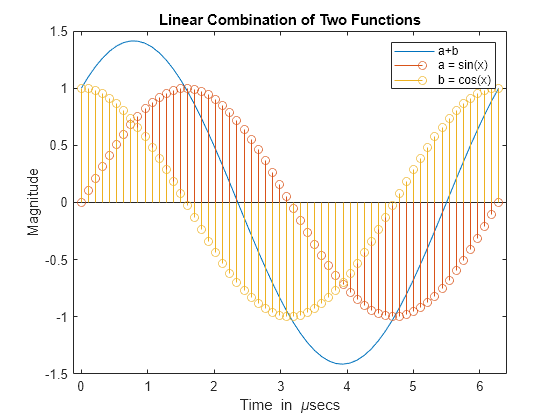
合并线图和针状图
此示例演示如何合并一个线图和两个针状图。然后,显示如何添加标题、坐标轴标签和图例。
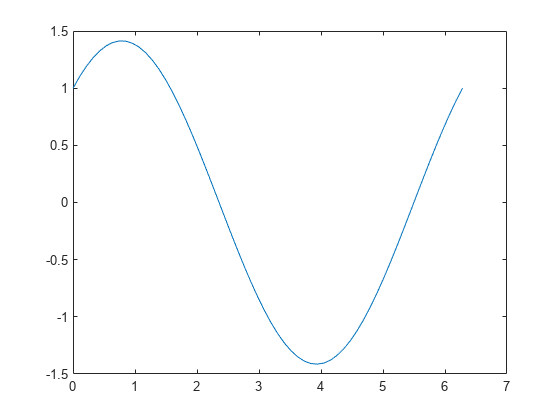
创建数据并绘制一条线条。
x = linspace(0,2*pi,60);
a = sin(x);
b = cos(x);
plot(x,a+b)
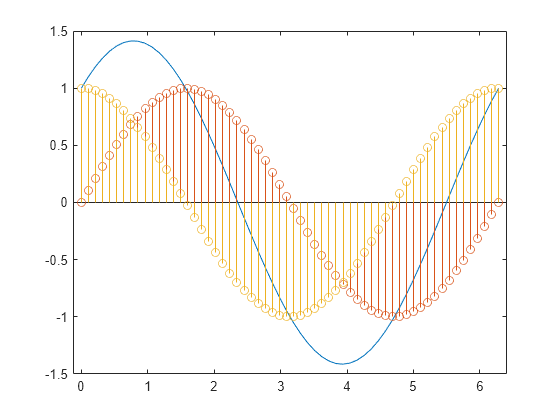
在坐标区中添加两个针状图。使用 hold on 防止新绘图替换现有的绘图。
hold on
stem(x,a)
stem(x,b)
hold off
添加标题、坐标轴标签和图例。按照创建绘图的顺序指定图例说明。
title('Linear Combination of Two Functions')
xlabel('Time in \musecs')
ylabel('Magnitude')
legend('a+b','a = sin(x)','b = cos(x)')