hold
添加新绘图时保留当前绘图
说明
hold on 将坐标区的保留状态设置为 on,这将保留当前坐标区中的绘图,从而使新添加到坐标区中的绘图不会删除现有绘图。当保留状态为 on 时,新绘图基于坐标区的 ColorOrder 和 LineStyleOrder 属性使用后续的颜色和线型。MATLAB® 将调整坐标区的范围、刻度线和刻度标签以显示完整范围的数据。如果坐标区对象不存在,则 hold 命令会创建一个。
hold off 将坐标区保留状态设置为 off,从而使新添加到坐标区中的绘图清除现有绘图并重置所有的坐标区属性。当保留状态处于关闭状态时,添加到坐标区的下一个绘图基于坐标区的 ColorOrder 和 LineStyleOrder 属性使用第一个颜色和线型。此选项为默认行为。
hold 在 on 和 off 之间切换保留状态。
hold( 通过指定 state)state 值来设置坐标区保留状态。您可以将 state 指定为 "on"、"off"、逻辑值或 OnOffSwitchState 值。
示例
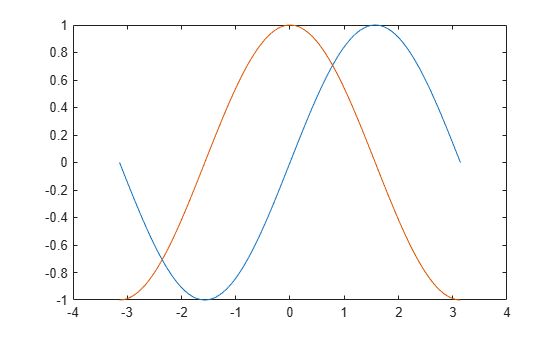
创建一个线图。使用 hold on 添加第二个线图,而不删除已有的线图。新绘图基于坐标区的 ColorOrder 和 LineStyleOrder 属性使用下一种颜色和线型。然后将保留状态重置为 off。
x = linspace(-pi,pi);
y1 = sin(x);
plot(x,y1)

hold on
y2 = cos(x);
plot(x,y2)
hold off
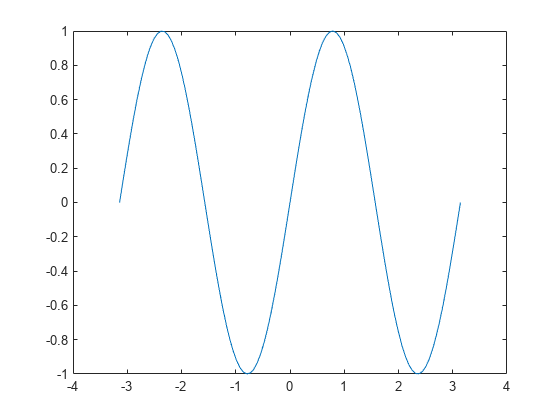
当保留状态为 off 时,新绘图将删除现有绘图。新绘图从色序和线型序列的开头开始。
y3 = sin(2*x);
plot(x,y3)
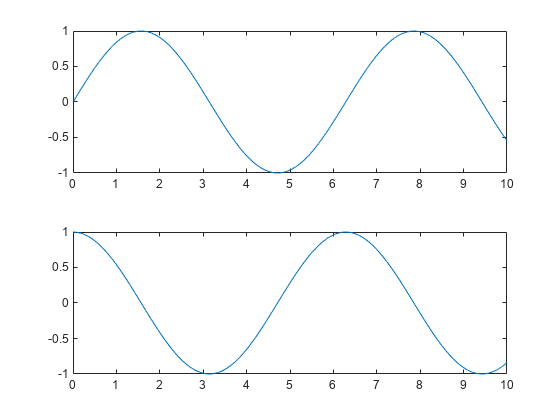
您可以使用 tiledlayout 和 nexttile 函数显示分块图。调用 tiledlayout 函数以创建一个 2×1 分块图布局。调用 nexttile 函数以创建坐标区对象 ax1 和 ax2。在每个坐标区中绘制一个正弦波图。
x = linspace(0,10);
y1 = sin(x);
y2 = cos(x);
tiledlayout(2,1)

% Top plot
ax1 = nexttile;
plot(ax1,x,y1)

% Bottom plot
ax2 = nexttile;
plot(ax2,x,y2)
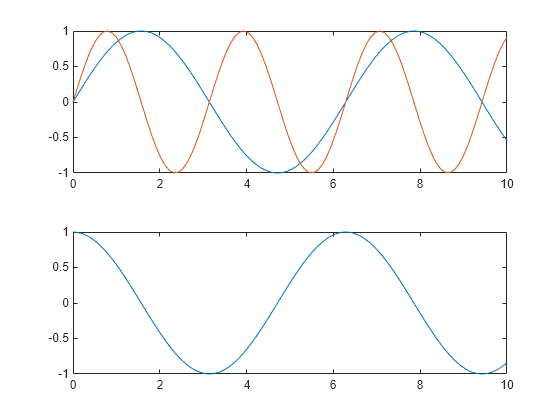
向上方坐标区添加第二个正弦波。
hold(ax1,'on')
y3 = sin(2*x);
plot(ax1,x,y3)
hold(ax1,'off')
创建 1×2 分块图布局。调用 nexttile 函数以创建两个坐标区对象并在坐标区中绘图。
t = tiledlayout(1,2);
ax1 = nexttile;
ax2 = nexttile;
plot(ax1,[0 1 0 1])
scatter(ax2,rand(1,10),rand(1,10),'filled')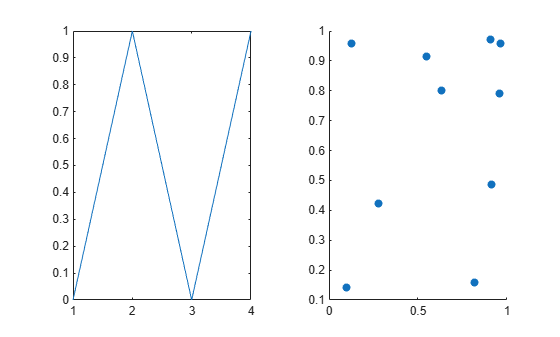
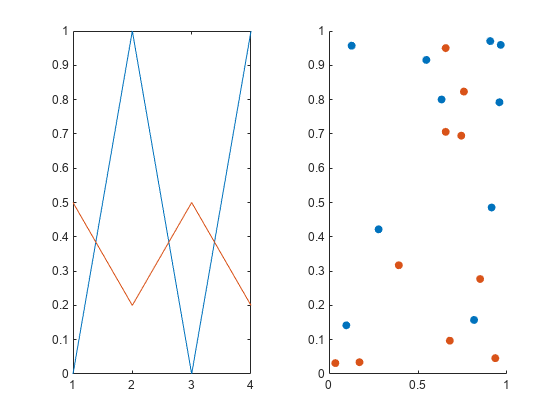
将两个坐标区的 hold 状态都设置为 'on'。然后在每个图中显示附加数据。
hold([ax1 ax2],'on')
plot(ax1,[.5 .2 .5 .2])
scatter(ax2,rand(1,10),rand(1,10),'filled')
输入参数
提示
使用
ishold函数测试保留状态。
算法
hold 函数设置以下属性: