newplot
指定图形对象的绘制位置
说明
示例
创建默认绘图坐标区。
newplot
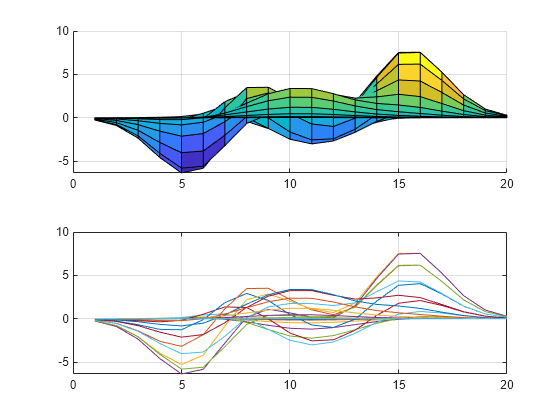
在图窗中放置两个 Axes 对象,并为每个 Axes 对象添加一个绘图。将坐标区指定为每个绘图函数的第一个输入参量。
tiledlayout('flow')
ax1 = nexttile;
ax2 = nexttile;

plot(ax1,peaks(20))
surf(ax2,peaks(20))

view([450 0])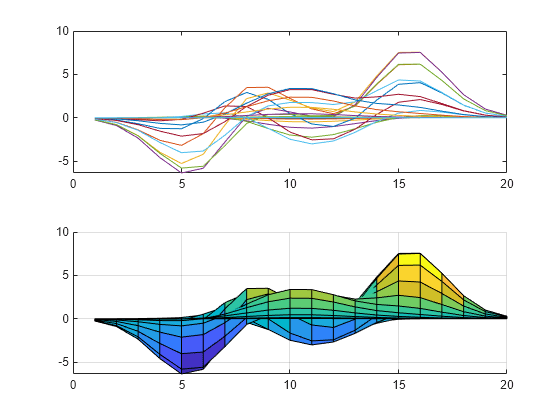
默认情况下,ax2 的 NextPlot 属性值为 'replace'。将 NextPlot 属性值更改为 'add'。
ax2.NextPlot
ans =
'replace'
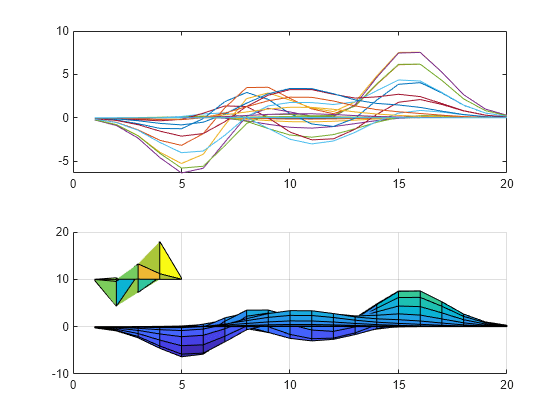
ax2.NextPlot = 'add';当坐标区 NextPlot 属性值为 'add' 时,在坐标区中绘图不会重置坐标区属性或从坐标区中删除子对象。新值与现有子对象一起绘制。
newplot(ax2)
surf(ax2,peaks(5)+10)
创建两个 Axes 对象,并向其中一个对象添加绘图。
tiledlayout("flow")
ax1 = nexttile;
ax2 = nexttile;

surf(ax1,peaks(20))

nexttile(1)
view([450 0])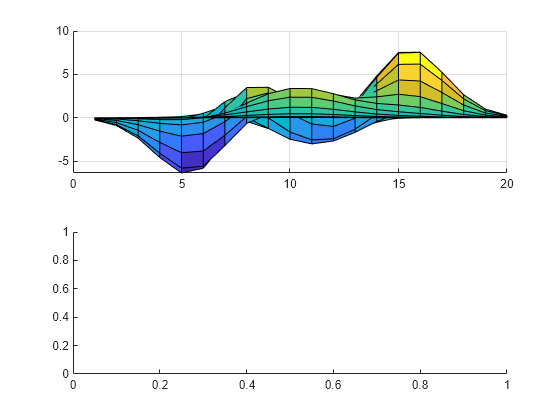
返回 Axes 对象,并通过设置该对象的属性来自定义坐标区的外观。例如,显示框轮廓和网格线。然后将坐标区的 NextPlot 属性设置为 "add"。
curr = newplot(ax2);

curr.Box = "on";
curr.XGrid = "on";
curr.YGrid = "on";
curr.NextPlot = "add";
向第二个 Axes 对象添加绘图。
plot(curr,peaks(20))
编写名为 myPlot 的函数,该函数在绘制数据的同时考虑到了保留状态,无论该状态是 on 还是 off。在该函数中,调用 newplot 为新绘图准备当前坐标区;如果不存在坐标区,则创建坐标区。
function myPlot(data)
ax = newplot;
line(ax,XData=1:numel(data),YData=data,Marker="o");
end
使用 myPlot 绘制一些数据。如果找不到现有坐标区,则在 myPlot 函数中调用 newplot 会创建新坐标区。
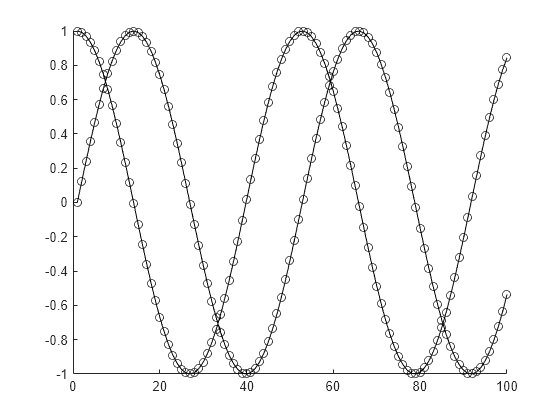
d = linspace(0,12,100);
myPlot(sin(d));
打开 hold 状态,并使用 myPlot 绘制另一组数据。由于 hold 函数设置当前坐标区的 NextPlot 属性,因此对 newplot 的本次调用可确保 myPlot 函数会将该数据添加到现有绘图中。
hold on
myPlot(cos(d));
hold off
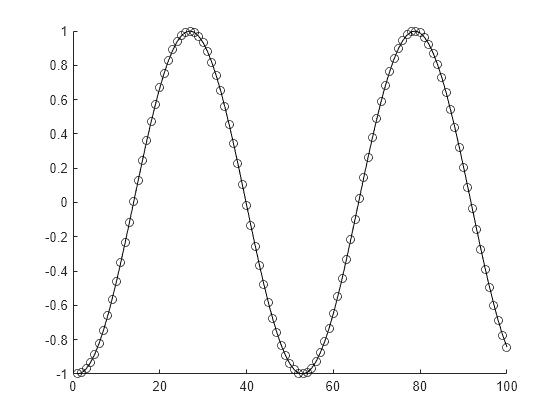
现在,便可用新绘图替换坐标区的内容。由于 hold 已关闭,因此 myPlot 会替换以前坐标区的内容。
myPlot(cos(d+pi));
输入参数
算法
newplot 函数的行为取决于图窗的 NextPlot 属性和坐标区的 NextPlot 属性。
首先,newplot 函数会查询图窗的 NextPlot 属性。下表显示 newplot 函数如何根据 NextPlot 的值更改图窗。
|
|
|---|---|
|
|
|
|
|
此行为等效于使用 |
|
此行为等效于使用 |
然后,newplot 函数查询图窗中坐标区的 NextPlot 属性。下表显示 newplot 函数如何根据其 NextPlot 属性的值来更改坐标区。
|
|
|---|---|
|
此行为等效于调用带 |
|
|
|
此行为等效于调用不带 |
|
对于只有一个 y 轴的坐标区, |
版本历史记录
在 R2006a 之前推出