主要内容

axes

R2026b

创建笛卡尔坐标区

描述

axes 在当前图窗中创建默认的笛卡尔坐标区,并将其设置为当前坐标区。通常情况下,您不需要在绘图之前创建坐标区,因为如果不存在坐标区,图形函数会在绘图时自动创建坐标区。

axes(Name=Value) 使用一个或多个名称-值参量修改坐标区的外观或控制数据的显示方式。例如,FontSize=14 可设置坐标区文本的字体大小。有关属性列表,请参阅 Axes 属性。

示例

axes(parent,Name=Value) 在由 parent 指定的图窗、面板或选项卡中创建坐标区,而不是在当前图窗中创建。

示例

ax = axes(___) 返回创建的 Axes 对象。可在创建 Axes 对象后使用 ax 查询和修改对象属性。有关属性列表,请参阅 Axes 属性。

axes(cax) 将父图窗的 CurrentAxes 属性设置为 cax。如果父图窗的 HandleVisibility 属性设置为 "on",则 cax 将成为当前坐标区。此命令还将 cax 设置为父对象的 Children 属性中列出的第一个对象。父对象通常是一个图窗或一个分块图布局。

示例

全部折叠

在图窗中放置两个 Axes 对象,并为每个对象添加一个绘图。

指定第一个 Axes 对象的位置,使其左下角位于点 (0.1 0.1) 处,宽度和高度均为 0.7。指定第二个 Axes 对象的位置,使其左下角位于点 (0.65 0.65) 处,宽度和高度均为 0.28。默认情况下,所有值为基于图窗的归一化值。将这两个 Axes 对象返回为 ax1 和 ax2。

figure
ax1 = axes(Position=[0.1 0.1 0.7 0.7]);
ax2 = axes(Position=[0.65 0.65 0.28 0.28]);
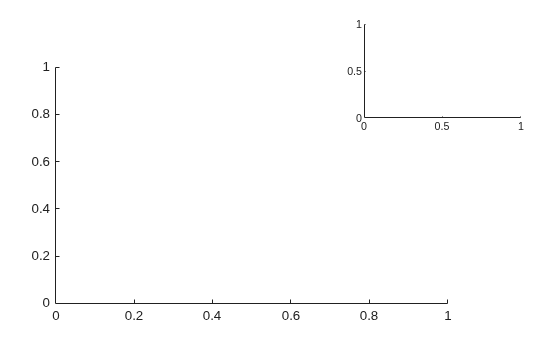
Figure contains 2 axes objects. Axes object 1 is empty. Axes object 2 is empty.

在每个 Axes 对象上添加一个绘图。通过将坐标区作为第一个输入参量传递给图形函数来指定坐标区。大多数图形函数会重置某些坐标区属性,如刻度值和标签。但是,它们不会重置坐标区的位置。

contour(ax1,peaks(20))
surf(ax2,peaks(20))
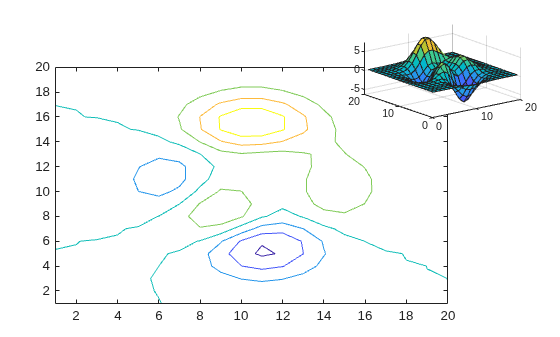
Figure contains 2 axes objects. Axes object 1 contains an object of type contour. Axes object 2 contains an object of type surface.

创建两个重叠的 Axes 对象。然后指定当前坐标区并添加一个绘图。

首先创建两个 Axes 对象并指定它们的位置。在每个坐标区周围显示框轮廓。将这两个 Axes 对象返回为 ax1 和 ax2。

figure
ax1 = axes(Position=[0.1 0.1 .6 .6],Box="on");
ax2 = axes(Position=[.35 .35 .6 .6],Box="on");
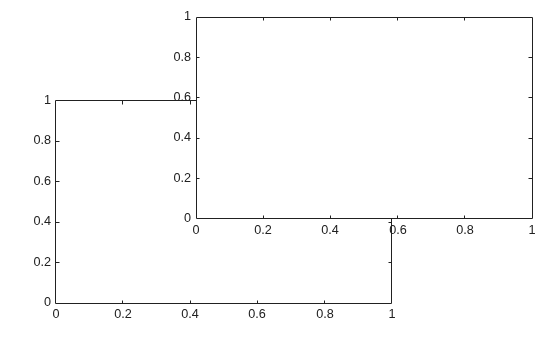
Figure contains 2 axes objects. Axes object 1 is empty. Axes object 2 is empty.

将 ax1 设置为当前坐标区。此操作将使该坐标区显示在最前面,并使其成为后续图形函数的目标。在坐标区上添加一个线图。

axes(ax1)
x = linspace(0,10);
y = sin(x);
plot(x,y)
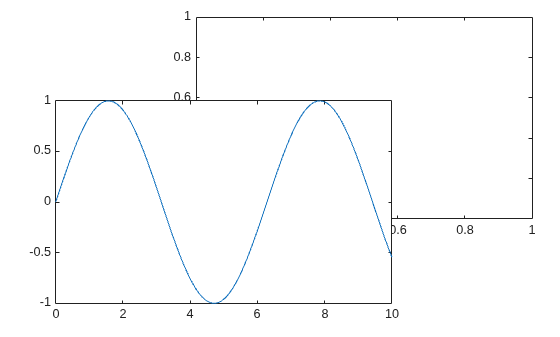
Figure contains 2 axes objects. Axes object 1 is empty. Axes object 2 contains an object of type line.

创建包含两个选项卡的图窗。通过为每个选项卡指定父容器,将坐标区添加到每个选项卡上。在第一个选项卡中绘制一条直线,在第二个选项卡中绘制一个曲面。

figure
tab1 = uitab(Title="Tab1");
ax1 = axes(tab1);
plot(ax1,1:10)

tab2 = uitab(Title="Tab2");
ax2 = axes(tab2);
surf(ax2,peaks)
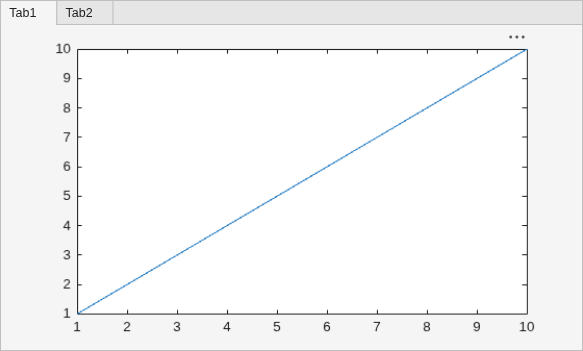
Figure contains 2 axes objects and another object of type uitabgroup. Axes object 1 contains an object of type surface. Axes object 2 contains an object of type line.

输入参数

全部折叠

父容器,指定为 Figure、Panel、Tab、TiledChartLayout 或 GridLayout 对象。

要设置为当前坐标区的坐标区,指定为 Axes 对象、PolarAxes 对象、GeographicAxes 对象或独立可视化,如 heatmap。

如果您希望将某个对象设置为当前坐标区但不改变图窗的状态,请设置包含该对象的图窗的 CurrentAxes 属性,例如:

fig = gcf;
fig.CurrentAxes = cax;
如果您希望在图窗保持最小化或置于其他图窗下方时将其坐标区指定为当前坐标区,则此方法很有用。

名称-值参数

全部折叠

将可选参量对组指定为 Name1=Value1,...,NameN=ValueN,其中 Name 是参量名称,Value 是对应的值。名称-值参量必须出现在其他参量之后,但对各个参量对组的顺序没有要求。

示例: axes(Position=[.3 .3 .5 .5]) 设置位置。

有些图形函数会在绘图时更改坐标区属性值,例如坐标轴范围或刻度值。可在绘图后设置坐标区属性。

注意

此处所列的属性只是一部分。有关完整列表,请参阅 Axes 属性。

大小和位置,不包括标签边距,指定为 [left bottom width height] 形式的四元素向量。默认情况下,MATLAB® 按照归一化的容器单位来测量值。要更改单位,请设置 Units 属性。

  • left 和 bottom 元素定义从容器(通常为图窗、面板或选项卡)左下角到位置边界左下角之间的距离。

  • width 和 height 元素是位置边界维度。对于三维视图中的坐标区,Position 属性是包围坐标区的最小矩形。

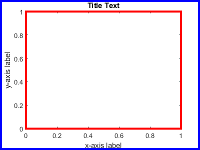
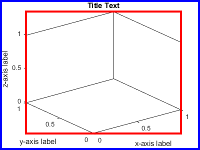
如果要指定位置并考虑让文本围绕坐标区,请改为设置 OuterPosition 属性。下图显示由 OuterPosition 值(蓝色)和 Position 值(红色)定义的区域。

二维坐标区视图三维坐标区视图

2-D axes with a title and axis labels. The inner position is outlined in red. It encloses the plot box only. The title, axis labels, and tick labels lie outside this rectangle. The outer position is outlined in blue. It encloses the plot box, the title, and the axis labels.

3-D axes with a title and axis labels. The inner position is outlined in red. It encloses the plot box. The title and axis labels lie outside this rectangle. Depending on the orientation of the plot box, some of the tick labels might lie inside or outside of this rectangle. The outer position is outlined in blue. It encloses the plot box, the title, and all of the axis labels.

有关坐标区位置的详细信息,请参阅控制坐标区布局。

注意

  • 当查询具有约束纵横比的坐标区(如方形坐标区或包含图像的坐标区)的位置时,可考虑使用 tightPosition 函数以获得更高的准确度。(从 R2022b 开始)

  • 当父容器为 TiledChartLayout 时,设置此属性不起作用

大小和位置,包括标签和边距,指定为 [left bottom width height] 形式的四元素向量。默认情况下,MATLAB 按照归一化的容器单位来测量值。要更改单位,请设置 Units 属性。[0 0 1 1] 的默认值包括容器的整个内部。

  • left 和 bottom 元素定义从容器(通常为图窗、面板或选项卡)左下角到外部位置边界左下角之间的距离。

  • width 和 height 元素是外边界尺寸。

下图显示由 OuterPosition 值(蓝色)和 Position 值(红色)定义的区域。

二维坐标区视图三维坐标区视图

2-D axes with a title and axis labels. The inner position is outlined in red. It encloses the plot box only. The title, axis labels, and tick labels lie outside this rectangle. The outer position is outlined in blue. It encloses the plot box, the title, and the axis labels.

3-D axes with a title and axis labels. The inner position is outlined in red. It encloses the plot box. The title and axis labels lie outside this rectangle. Depending on the orientation of the plot box, some of the tick labels might lie inside or outside of this rectangle. The outer position is outlined in blue. It encloses the plot box, the title, and all of the axis labels.

有关坐标区位置的详细信息,请参阅控制坐标区布局。

注意

当父容器为 TiledChartLayout 对象时,设置此属性不起作用。

位置单位,指定为下列值之一:

Units描述
"normalized"(默认值)根据容器进行归一化,容器通常是图窗或面板。容器的左下角映射到 (0,0),右上角映射到 (1,1)。
"inches"英寸。
"centimeters"厘米。
"characters"

基于图形根对象的默认 uicontrol 字体:

  • 字符宽度 = 字母 x 的宽度。

  • 字符高度 = 两个文本行的基线之间的距离。

"points"字体磅数。一磅等于 1/72 英寸。
"pixels"

像素。

在 Windows® 和 Macintosh 系统上,像素的大小为 1/96 英寸。此大小与系统分辨率无关。

在 Linux® 系统上,一个像素的大小由系统分辨率确定。

在对象创建过程中将单位指定为 Name=Value 时,您必须先设置 Units 属性,然后再指定要使用这些单位的属性(如 Position)。

详细信息

全部折叠

版本历史记录

在 R2006a 之前推出