控制坐标区布局
与位置相关的属性和函数
有几个属性和函数可用于获取和设置坐标区的大小与位置。下表摘要显示了这些属性和函数。
| 函数或属性 | 描述 |
|---|---|
使用此属性可以查询或更改坐标区的外边界,包括标题、标签和边距。要更改外边界,请将此属性指定为 | |
| 使用此属性可以查询或更改绘图区域,此区域通常由图框限定。此区域不包括标题、标签以及标题和标签周围的边距。要更改绘图区域的大小,请将此属性指定为 |
| 使用此函数可以查询绘图区域,此区域通常由图框限定。对于具有约束纵横比的坐标区(如方形坐标区、极坐标区或包含图像的坐标区),该函数通常能返回比 |
| 使用此属性可以查询包含标题、刻度标签和轴标签在内的图框周围的边距。在添加轴标签和标题时,MATLAB® 会更新此属性以适应文本。 |
使用此属性可以查询或控制在添加标题或标签时是保留绘图区域(坐标区内)还是保留坐标区的外边界。要更改保留坐标区的哪些区域,请将此属性指定为 | |
Units 属性 | 使用此属性可以查询或更改坐标区位置值的单位。值必须设置为 |
| 使用此函数可调整坐标区范围或纵横比,而无需执行计算或设置特定属性。例如:
|
位置和边距的边界
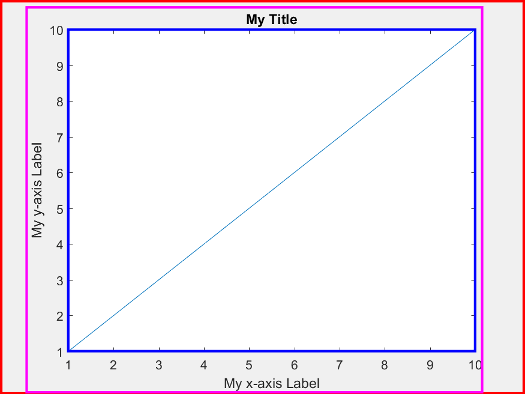
下图显示了一个二维视图,其中 OuterPosition 值定义红色区域、Position 值定义蓝色区域,以及基于 Position 外扩 TightInset 值所定义的品红色区域。
下图显示了一个三维视图,同样包含了由 OuterPosition 值定义的坐标区外边界区域(红色)、Position 值定义的坐标区内边界区域(蓝色),以及在 Position 内边界基础上外扩 TightInset 值所定义的坐标区区域(品红色)。

方形或具有约束纵横比坐标区的位置
自 R2022b 起
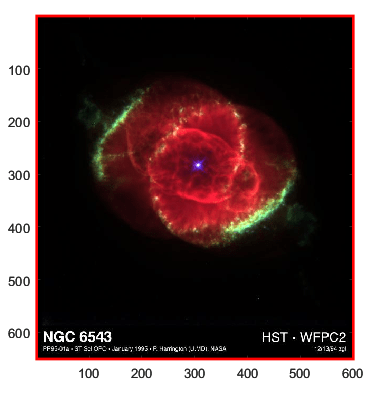
如果坐标区具有约束纵横比,例如,如果您正在绘制一个图像,Position 属性和 tightPosition 函数返回不同结果。根据您要创建的演示内容的类型,使用其中一项。
例如,显示图像。使用 axis 函数保留图像的纵横比。
figure
C = imread("ngc6543a.jpg");
ax = axes;
image(C)
axis image
通过调用 tightPosition 函数获得位置向量。使用向量在当前显示在坐标区中的图像周围绘制红色矩形。
tpos = tightPosition(ax);
annotation("rectangle",tpos,Color="red",LineWidth=2)
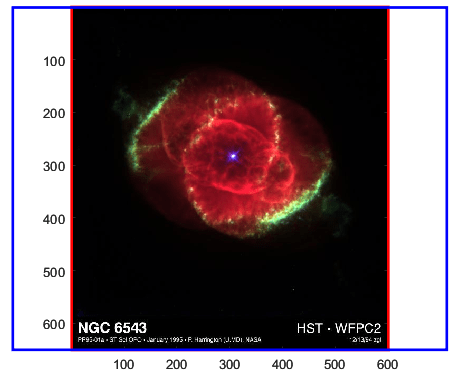
通过查询坐标区的 Position 属性获得另一个位置向量。使用向量绘制一个蓝色矩形,该矩形定义类似大小的图像的绘图区域,但具有默认纵横比。当显示一系列具有不同纵横比的多个图像时,该向量中的值对查询整个图像区域可能会有所帮助。
pos = ax.Position;
annotation("rectangle",pos,Color="blue",LineWidth=2)
控制自动调整大小行为
某些情况可能触发 Axes 对象自动调整大小。例如,以交互方式调整图窗大小或添加标题或轴标签将激活自动调整大小。有时,新坐标区的大小无法同时满足 Position 和 OuterPosition 值,这种情况下需要使用 PositionConstraint 属性来指示要保留哪个值。
将 PositionConstraint 属性指定为下列值之一:
"outerposition"- 保留OuterPosition值。如果不希望坐标区或任何周围文本超出特定外边界,可使用此选项。MATLAB 会调整坐标区内部区域大小(显示绘图时),以尽力在外边界范围内适应内容。"innerposition"- 保留InnerPosition值。如果希望坐标区的内部区域在图窗中保持特定大小,可使用此选项。此选项有时会导致文本溢出图窗。
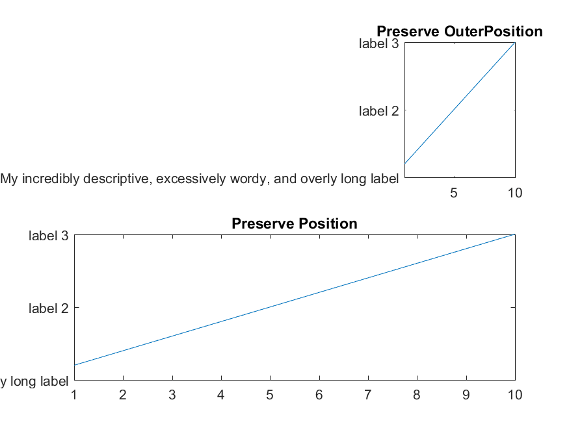
通常,将 PositionConstraint 属性设置为 "outerposition" 更可取。但是,坐标区标题或标签过长可能会使坐标区内部区域大大缩小,文字过小而难于阅读。在这种情况下,最好保持特定大小的内部坐标区,即使周围文本溢出了图窗也应如此。
例如,创建一个带有两个坐标区的图窗,并为每个坐标区位置指定相同的宽度和高度。对于上坐标区,将 PositionConstraint 属性设置为 "outerposition",对于下坐标区则设置为 "innerposition"。注意,在上坐标区中,内部区域会缩小以适应文本,但文本不会溢出图窗。在下坐标区中,会保留内部区域的大小,但部分文本被截断。
figure;
ax1 = axes("Position",[0.13 0.58 0.77 0.34]);
ax1.PositionConstraint = "outerposition";
plot(ax1,1:10)
title(ax1,"Preserve OuterPosition")
yticklabels(ax1,["My incredibly descriptive, excessively wordy, and overly long label",...
    "label 2","label 3"])

ax2 = axes("Position",[0.13 0.11 0.77 0.34]);
ax2.PositionConstraint = "innerposition";
plot(ax2,1:10)
title(ax2,"Preserve Position")
yticklabels(ax2,["My incredibly descriptive, excessively wordy, and overly long label",...
    "label 2","label 3"])
伸展填充行为
默认情况下,MATLAB 会伸展坐标区以填充可用的空间。这种“伸展填充”行为可能会导致部分扭曲。坐标区可能与其 DataAspectRatio、PlotBoxAspectRatio 和 CameraViewAngle 属性中存储的数据纵横比、图框纵横比和相机视角值不完全匹配。Axes 对象的 DataAspectRatioMode、PlotBoxAspectRatioMode 和 CameraViewAngleMode 属性设置为 "auto" 时,会启用“伸展填充”行为。
如果您指定数据纵横比、绘图框纵横比或相机视角,则会禁用“伸展填充”行为。如果禁用“伸展填充”行为,MATLAB 会使坐标区在可用空间内尽可能大并严格遵循属性值,不会出现扭曲。
例如,以下图窗分别显示了同一绘图在启用和未启用“伸展填充”行为时的效果。在两种情况中,数据纵横比、绘图框纵横比和相机视角值是相同的。但是,在左侧绘图中,伸展造成了一定的变形。
| 启用伸展填充(一定的变形) | 禁用伸展填充(无变形) |
|---|---|
|
|


另请参阅
函数
axes|tiledlayout|title|daspect|pbaspect