对保留状态进行响应
此示例演示如何在用户定义绘图函数中测试 hold 状态并正确响应。
绘图函数通常会改变各种坐标区参数以适应不同的数据。myPlot3D 函数:
根据输入数据使用二维或三维视图。
遵守当前
hold状态,与 MATLAB® 绘图函数行为一致。
function myPlot3D(x,y,z)
   % Call newplot to get the axes handle
   cax = newplot;
   % Save current hold state
   hold_state = ishold;
   % Call plotting commands to
   % produce custom graph
   if nargin == 2
      line(x,y);
      % Change view only if hold is off
      if ~hold_state
         view(cax,2)
      end
   elseif nargin == 3
      line(x,y,z);
      % Change view only if hold is off
      if ~hold_state
         view(cax,3)
      end
   end
   grid on
end
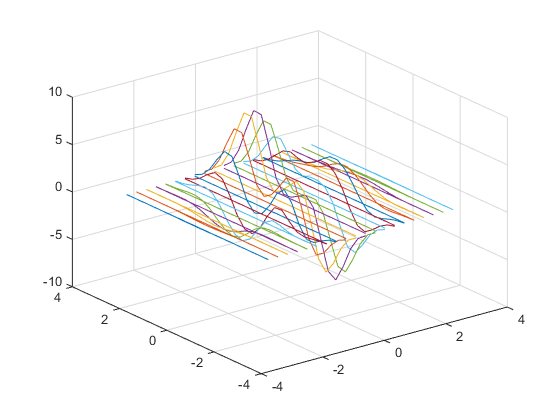
例如,第一次 myPlot3D 调用创建一个三维图形。第二次调用 myPlot3D 将二维数据添加到三维视图,这是因为 hold 为 on。
[x,y,z] = peaks(20);
myPlot3D(x,y,z)
hold on
myPlot3D(x,y)