Convert MATLAB Code into Experiment
This example shows how to convert your existing MATLAB code into an experiment that you can run using the Experiment Manager app.
This script creates a histogram that shows that the 13th day of the month is more likely to fall on a Friday than on any other day of the week. For more information, see Chapter 3 of Experiments with MATLAB by Cleve Moler.
date = 13;

daysOfWeek = ["Sunday","Monday","Tuesday","Wednesday", ...
    "Thursday","Friday","Saturday"];
values = zeros(1,7);

for year = 1601:2000
    for month = 1:12
        d = datetime(year,month,date);
        w = weekday(d);
        values(w) = values(w) + 1;
    end
end

[minValue,maxValue] = bounds(values);
avgValue = mean(values);

figure(Name="Histogram")
bar(values)
axis([0 8 floor((minValue-1)/10)*10 ceil((maxValue+1)/10)*10])
line([0 8],[avgValue avgValue],linewidth=4,color="black")
set(gca,xticklabel=daysOfWeek)
You can convert this script into an experiment by following these steps. Alternatively, open the example to skip the conversion steps and load a preconfigured experiment that runs a converted version of the script.
1. Close any open projects and open the Experiment Manager app.
2. A dialog box provides links to the getting started tutorials and your recent projects, as well as buttons to create a new project or open an example from the documentation. Under New, select Blank Project.

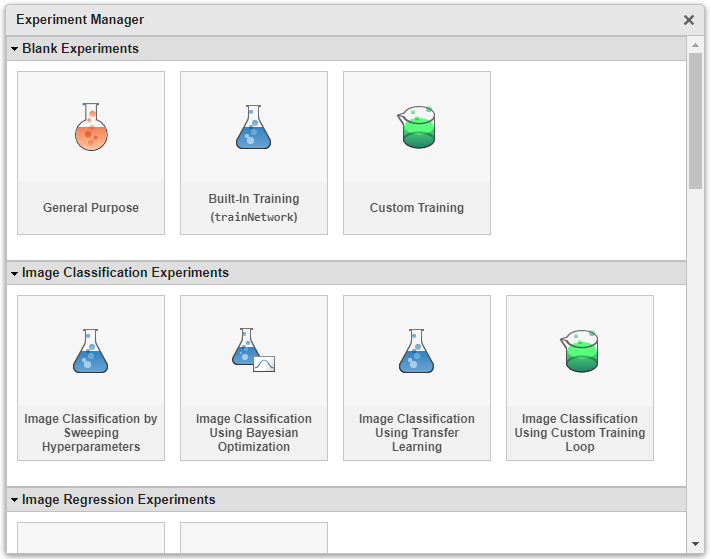
3. If you have Deep Learning Toolbox or Statistics and Machine Learning Toolbox, Experiment Manager opens a second dialog box that lists several templates to support your AI workflows. Under Blank Experiments, select General Purpose.

4. Specify the name and location for the new project. Experiment Manager opens a new experiment in the project. The experiment definition tab displays the description, parameters, and experiment function that define the experiment. For more information, see Create Experiment.

5. In the Description field, enter a description of the experiment:
Count the number of times that a given day and month falls on each day of the week.
To scan all months, set the value of Month to 0.
6. Under Parameters, add a parameter called Day with a value of 21 and a parameter called Month with a value of 0:3:12.
7. Under Experiment Function, click Edit. A blank experiment function called Experiment1Function1 opens in MATLAB Editor. The experiment function has an input argument called params and two output arguments called output1 and output2.
8. Copy and paste your MATLAB code into the body of the experiment function.
9. Replace the hard-coded value for the variable date with the expression params.Day. This expression uses dot notation to access the parameter values that you specified in step 6.
date = params.Day;
10. Add a new variable called monthRange that accesses the value of the parameter Month. If this value equals zero, set monthRange to the vector 1:12.
monthRange = params.Month;
if monthRange == 0
    monthRange = 1:12;
end
11. Use monthRange as the range for the for loop with counter month. Additionally, use the day function to account for months with fewer than 31 days.
for year = 1601:2000
    for month = monthRange
        d = datetime(year,month,date);
        if day(d) == date
            w = weekday(d);
            values(w) = values(w) + 1;
        end
    end
end
12. Rename the output arguments to MostLikelyDay and LeastLikelyDay. Use this code to compute these outputs after you calculate the values of maxValue, minValue, and avgValue:
maxIndex = ~(maxValue-values);
maxIndex = maxIndex.*(1:1:7);
maxIndex = nonzeros(maxIndex)';
MostLikelyDay = join(daysOfWeek(maxIndex));

minIndex = ~(values-minValue);
minIndex = minIndex.*(1:1:7);
minIndex = nonzeros(minIndex)';
LeastLikelyDay = join(daysOfWeek(minIndex));
After these steps, your experiment function contains this code:
function [MostLikelyDay,LeastLikelyDay] = Experiment1Function1(params)

date = params.Day;

monthRange = params.Month;
if monthRange == 0
    monthRange = 1:12;
end

daysOfWeek = ["Sunday","Monday","Tuesday","Wednesday", ...
    "Thursday","Friday","Saturday"];
values = zeros(1,7);

for year = 1601:2000
    for month = monthRange
        d = datetime(year,month,date);
        if day(d) == date
            w = weekday(d);
            values(w) = values(w) + 1;
        end
    end
end

[minValue,maxValue] = bounds(values);
avgValue = mean(values);

maxIndex = ~(maxValue-values);
maxIndex = maxIndex.*(1:1:7);
maxIndex = nonzeros(maxIndex)';
MostLikelyDay = join(daysOfWeek(maxIndex));

minIndex = ~(values-minValue);
minIndex = minIndex.*(1:1:7);
minIndex = nonzeros(minIndex)';
LeastLikelyDay = join(daysOfWeek(minIndex));

figure(Name="Histogram")
bar(values)
axis([0 8 floor((minValue-1)/10)*10 ceil((maxValue+1)/10)*10])
line([0 8],[avgValue avgValue],linewidth=4,color="black")
set(gca,xticklabel=daysOfWeek)

end
To run the experiment, on the Experiment Manager toolstrip, click Run. Experiment Manager runs the experiment function five times, each time using a different combination of parameter values. A table of results displays the output values for each trial.

To display a histogram for each completed trial, under Review Results, click Histogram.

The results of the experiment show that the 21st day of the month is more likely to fall on a Saturday than on any other day of the week. However, the summer solstice, June 21, is more likely to fall on a Sunday, Tuesday, or Thursday.