Main Content

Get Started with the New Desktop for MATLAB (Beta)

Since R2024b

The new desktop for MATLAB® includes new and updated features, such as:

  • Dark theme support

  • An updated layout

  • A new figure window experience

  • Expanded search capabilities

  • A new plain text file format for live scripts

  • A new Debugger panel and Source Control panel

  • Enhanced workflows for MATLAB projects

  • Improved screen reader support

  • Extension points

To try these features, download and install the New Desktop for MATLAB (Beta) add-on from File Exchange.

Note

The new desktop for MATLAB is in beta development and should not be used for development or production activities. Report all feedback and issues directly to the development team by clicking the Feedback button directly above the MATLAB Toolstrip.

Dark Theme Support

Change the colors of the MATLAB desktop by using themes. For example, to select a dark theme, go to the Home tab, and in the Environment section, click Preferences. Select MATLAB > Appearance and set the Theme to Dark.

MATLAB desktop with all panels displayed with a dark background and light text

By default, the colors of figures and apps automatically update to match the selected MATLAB desktop theme. Starting in R2024a, you can override the desktop theme for an individual figure. To override the desktop theme of a figure, in the Figures toolstrip, go to the Format tab and select a theme. You also can change the figure theme programmatically by calling the theme function (since R2024b) or setting the Theme property of the figure to "light" or "dark". For example, this code shows two ways to set the theme for the figure f to light, regardless of the current desktop theme.

f = figure;
theme(f,"light");
f.Theme = "light";
To override the desktop theme for all figures, in the MATLAB Appearance Preferences page of the Preferences window, use the Figure Theme option. For example, to display all figures with a light theme, set the Figure Theme option to Light.

Before R2024b: To select the theme for all figures, set the GraphicsTheme setting to "light" or "dark". For example:

s = settings;
s.matlab.appearance.figure.GraphicsTheme.TemporaryValue = "light";

Updated Desktop Layout

The updated desktop layout includes sidebars on either side and on the bottom of the desktop to access desktop tools and change the desktop layout. Each sidebar shows the tools, such as the Workspace panel, Files panel, and Command Window, that are docked in that area of the desktop. If there are no tools docked in an area of the desktop, the sidebar for that area is hidden.

You can use the sidebars to show and hide tools, group tools together, move tools from one location to another, and open tools that are not in any of the sidebars.

  • Show or hide tool — Click the tool icon in the sidebar.

  • Group tools together — Drag one tool icon next to another tool icon.

  • Move tool to different location on desktop — Drag the tool or tool icon to the new location.

  • Open tool — Click the Open more panels button (three-dot icon). Then, in the Open Panel dialog box, select from the available tools.

MATLAB desktop showing the left sidebar containing five tool icons, two of which are grouped together and enabled, and the bottom sidebar containing one tool icon for the Command Window. The Command Window is open above the bottom sidebar. The Files panel and the Workspace panel are open on the left side of the desktop.

Enhanced Figure Window Capabilities

Explore data in the figures you create by using an enhanced set of figure tools and capabilities. When you create a figure by calling the figure function or by creating graphics, the figure appears larger and wider to better display your data. You can then use figure tools to interact with, customize, and compare the figures you create.

For example, you can use the enhanced figure capabilities to:

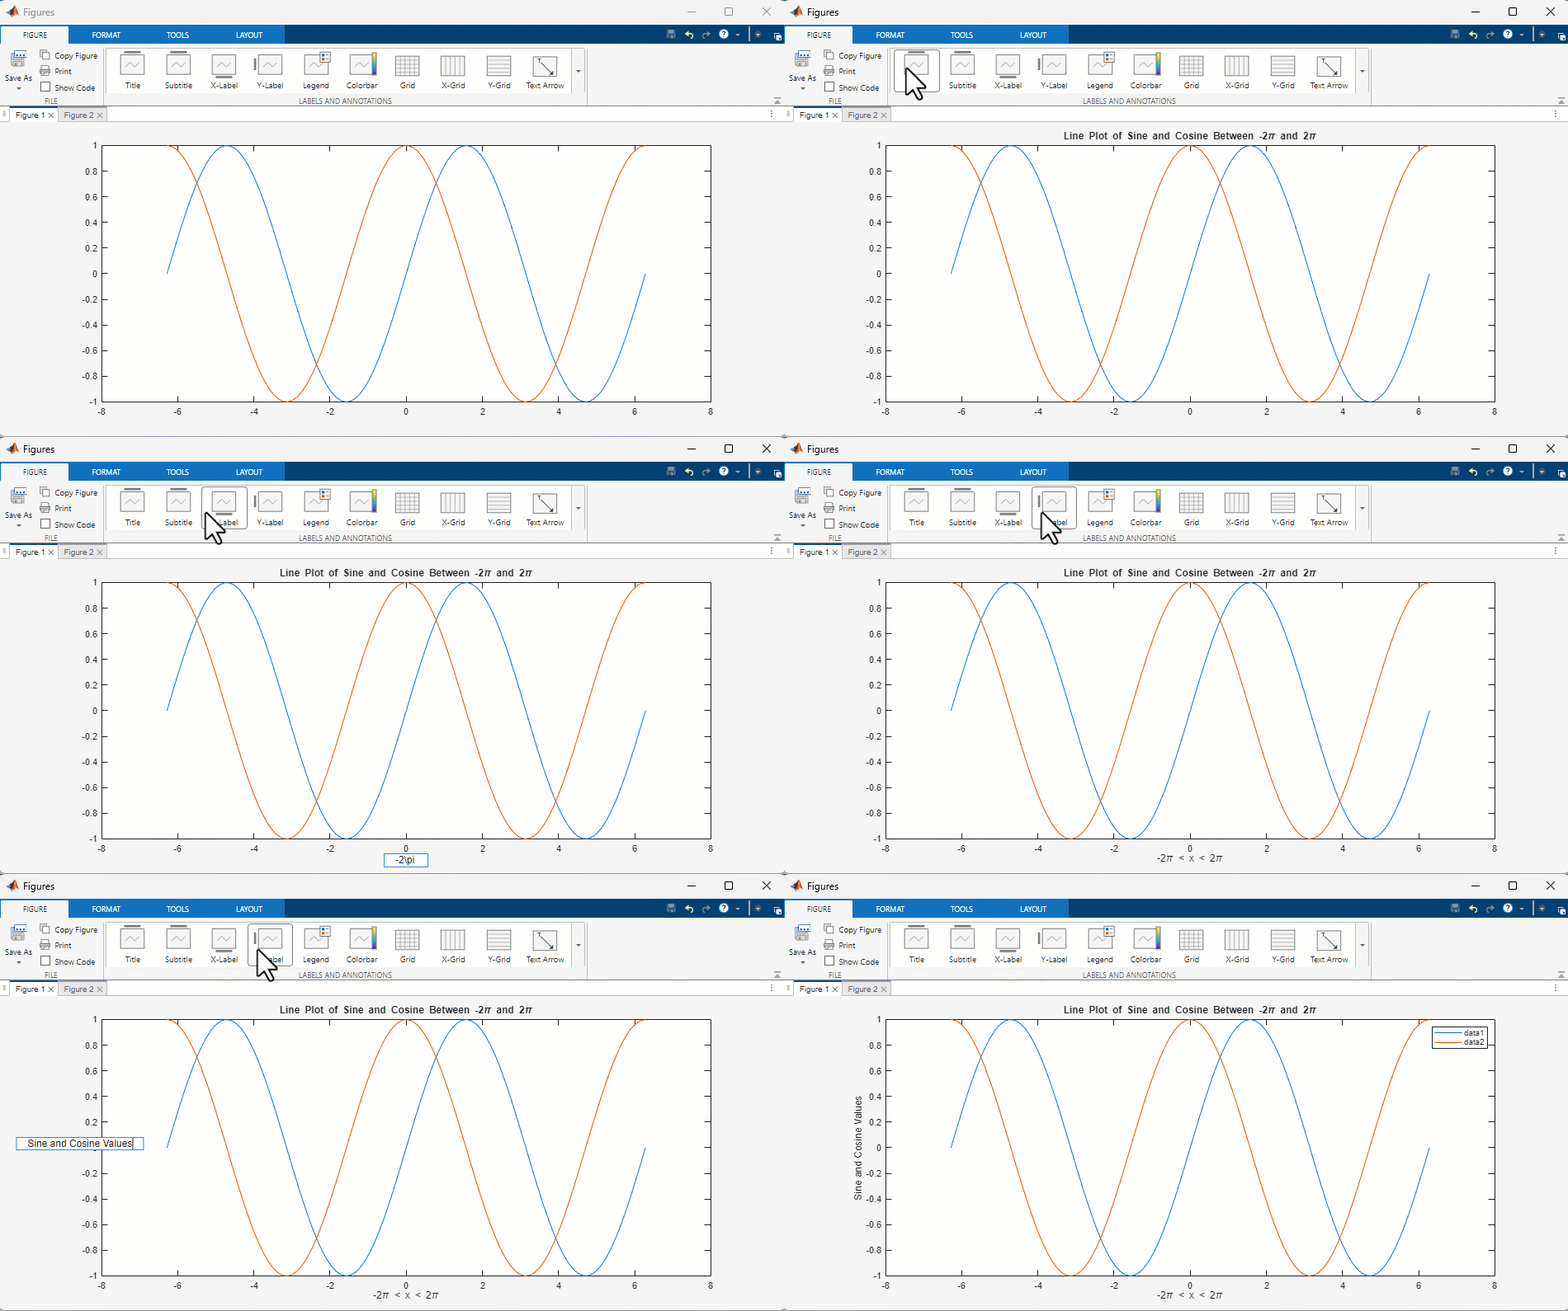
  • Format figure content interactively — Edit your figure content by using the new Figures toolstrip. You can use the toolstrip to change text styles and line styles, as well as add items such as titles, labels, legends, grid lines, arrows, and shapes. To change styles or add an item, select a figure, go to its Figure or Format tab, and select from the available options.

  • Reproduce figure changes — As you interactively change a figure, MATLAB generates code that represents the changes. You can use this code to reproduce the modified figure. In the Figure tab of the toolstrip, select Show Code and in the Generated Code panel under the figure, use the Copy all code button to copy the generated code.

  • View all figures and tools in a single area — Independent figures created with the default size and window state appear as tabs in a single tabbed figure window. You can use the tabs to quickly find and navigate to a specific figure. In addition, tools to modify the figure (such as the Figures toolstrip, the Property Inspector, and the Generated Code panel) appear as part of the same window.

  • Compare and arrange figures — View multiple figures at the same time by tiling figures in the tabbed figure window. Drag tabs to tile figures interactively.

Figures and tools in a tabbed figure window. The central portion of the window is split vertically into two sections, each of which contains a selected figure tab with a plot. The top section contains a second, unselected figure tab. Above the figures is a toolstrip with formatting options. To the right of the figures is the Property Inspector. Below the figures is the Generated Code panel.

Expanded Search Capabilities

Use the Search box in the top-right corner of the desktop to easily access toolstrip actions, preferences, and Help Center resources, such as functions, blocks, examples, and answers.

For example, to create a function, type the word function in the Search box. In the list of results, select the New - Function toolstrip action. MATLAB creates a file containing a basic function template and opens it in the Editor.

Search box containing the word function and a list of search results including toolstrip actions, functions, and blocks

New Plain Text File Format for Live Scripts

Starting in R2024b, you can save live scripts and functions using a plain text file format (.m). Live scripts saved using the plain text file format behave just like other live scripts. They open in the Live Editor and can contain code, output, and formatted text. They also can include interactive controls and tasks.

Note

This new file format is available only as part of the new desktop for MATLAB.

Live script open in the Live Editor containing text, code, and output, and saved using the plain text file format (.m)

The Live Editor uses custom markup to save formatted text, generated output, interactive controls, and tasks as plain text. The Live Editor saves the custom markup alongside the code and saves any additional essential data at the bottom of the file.

There are several benefits to saving live scripts using the plain text file format:

  • Files open in external code editor — You can open live scripts saved using the plain text file format in any external text or code editor that supports plain text files.

  • Increased transparency — Files saved using the plain text file format do not trigger security concerns. One exception might be if the live script contains images and plots, which are saved as Base64 (ASCII-binary) strings in the plain text file.

  • Improved integration with source control — You can use external source control tools to compare and merge live scripts saved using the plain text file format.

To save an existing live script as a new live script using the plain text file format (.m):

  1. On the Live Editor tab, in the File section, select Save > Save As.

  2. In the dialog box that appears, select MATLAB Code File (*.m) as the Save as type.

  3. Enter a filename. To avoid conflicts when running, use a different filename than the original file.

  4. Click Save.

To create new live scripts as plain text files by default, go to the Home tab, and in the Environment section, click Preferences. Select MATLAB > Editor/Debugger and in the Live script format section, set the Default live script file format to M.

Known Issues and Limitations

  • Some external source control tools have limitations around file size that might prevent the comparison of live scripts saved using the plain text file format. For the best results, try using GitHub® Desktop or Visual Studio Code. You also can reduce file size by clearing all output before submitting your files to source control.

  • The help and doc functions might display unexpected content for live functions saved using the plain text file format.

  • When comparing two live scripts or functions saved using the plain text file format, the Comparison Tool compares the files as plain text files instead of live scripts or functions.

  • Some programmatic functionality might be unavailable for live scripts and functions saved using the plain text file format.

Debugger Panel

Use the Debugger panel to manage breakpoints and navigate the function call stack while debugging. By default, the Debugger panel opens automatically when MATLAB enters debug mode. To open the Debugger panel manually, go to the Editor or Live Editor tab, and in the Analyze section, click Debugger. Alternatively, you can open the panel using the Open more panels button (three-dot icon) in a sidebar.

The Breakpoints section in the panel lists the breakpoints in all MATLAB code files. The first four breakpoints in the section (Pause on Errors, Pause on Warnings, Pause on NaN or Inf, and Pause on Unsuppressed Output) are error breakpoints. When you enable one of these breakpoints, MATLAB pauses at any line in any file if the specified error condition occurs. The remaining breakpoints are grouped by file.

The Function call stack section shows the list of functions MATLAB executed before pausing at the current line. The functions display in order, with the current script or function in which MATLAB is paused at the top of the list, and the first called script or function at the bottom of the list. For each function in the function call stack, there is a corresponding workspace. To view the workspace for a function in the function call stack, select that function in the list.

Debugger panel showing a Breakpoints section and a Function call stack section. The Breakpoints section shows Pause on Errors selected, as well as three enabled breakpoints in the plotRand.m file. The Function call stack section shows that the debugger is paused at line 3 of plotRand.m.

Source Control Panel

Use the Source Control panel to see all active source control repositories, manage modified files, and perform source control operations. To open the Source Control panel, use the Open more panels button (three-dot icon) in a sidebar.

Source Control panel showing two repositories. The first repository is under Git source control and the second is under SVN source control.

For files and folders under Git™ source control, you can use the Branch Manager to manage multiple local and remote repositories, find and compare commits, and create, delete, and merge branches. To open the Branch Manager, in the Source Control panel, click the Branch Manager button for the repository that you want to manage.

Branch Manager commit graph showing that the main branch is behind the BugFix branch

You also can view the line-by-line revision history for an entire MATLAB file under Git source control by using the Blame View option. To show the Blame View, open the file in the Editor. Then, in the gray area on the left side of the Editor, right-click and select Show Blame View. Alternatively, in the Files panel, right-click the file and select Source Control > Show Blame View.

File open in the MATLAB Editor. To the left of the file, Blame View shows line-by-line annotations. The first annotation is selected and a pop-up shows details about the author, commit date and ID, and commit message.

Enhanced Workflows for MATLAB Projects

MATLAB Projects includes an updated interface that provides access to enhanced workflows and new capabilities.

In the updated project interface, use the Project Settings window to manage all settings for your project. For example, you can view and edit project details, manage the project path and folder settings, manage dependencies to projects and packages, automate startup and shutdown actions, and create labels and custom tasks in a single interface. Project tools, such as Custom Tasks, Project Checks, Project Upgrade, and Dependency Analyzer, also have simpler interfaces and new capabilities.

Project Settings window for the Times Table App project showing the project name, description, root, and search path

Screen Reader Support

Use a screen reader and a keyboard to interact with the Command Window, create and edit scripts and functions in the Editor, and navigate through the different areas of the MATLAB desktop. For more information, see Accessibility in MATLAB.

Extension Points

Extend various functionalities of the MATLAB desktop using extension points. For example, you can use extension points to add items to the Files panel context menu or to the quick access toolbar. To use extension points, create a JSON-formatted file named extensions.json and add a set of JSON declarations to the file. Then, to enable your customizations, add extensions.json to the path.

For example, this extensions.json file uses the mw.desktop.quickAccess extension point to add an item to the quick access toolbar and the mw.desktop.fileBrowser.contextMenu extension point to add an item to the Files panel context menu.

{
    "mw.desktop.quickAccess": {
        "items": [
        {
            "name": "openCustomFunction",
            "type": "PushButton",
            "text": "Open Custom Function",
            "description": "Open my custom function",
            "icon": "./icons/Open_16.png",
            "command": "openMyFunction"
        }]
    },
    "mw.desktop.fileBrowser.contextMenu": {
        "customSection": {
            "items": [
            {
                "name": "displayAttributes",
                "type": "MenuItem",
                "text": "Display File Attributes",
                "description": "Tooltip hover information",
                "icon": "./icons/Display_16.png",
                "command": "displayFileAttributes"
            }]
         }
     }
}

For more information, see Extend MATLAB Using Extension Points (Beta).

Return to Original Desktop

To return to the original MATLAB desktop, click the Stop New Desktop button, and follow the prompts to restart MATLAB. If you return to the original desktop, you can try the new desktop again by clicking the Try the New Desktop button directly above the toolstrip.

To uninstall the new desktop and remove the buttons above the toolstrip, go to the Home tab, and in the Environment section, select Add-Ons > Add-Ons to open the Add-Ons panel. Click the Options button to the right of the New Desktop for MATLAB add-on and select Uninstall.

Known Issues

Software development is ongoing for the new desktop for MATLAB. For the most up-to-date list of known issues, see New Desktop for MATLAB (Beta) on File Exchange.