使用 Excel 作为自动化服务器读取电子表格数据
此示例说明如何使用 COM 自动化服务器从 MATLAB® 访问另一个应用程序。该示例创建了用于访问 Microsoft® Excel® 文件中的数据的用户界面。如果您在应用程序中未使用组件对象模型 (COM),请参阅电子表格中的函数和示例,以获取将 Excel 电子表格数据导入 MATLAB 的备选方法。
为实现 MATLAB 与电子表格程序之间的通信,该示例在运行 Excel 应用程序的自动化服务器中创建了一个对象。然后,MATLAB 通过 Excel 自动化服务器提供的接口访问电子表格中的数据。最后,该示例创建了用于访问 Microsoft Excel 文件中的数据的用户界面。
演示的方法
使用自动化服务器,从 MATLAB 访问其他应用程序。
将 Excel 数据转换为界面和绘图中所用类型的方法。
以下方法说明如何可视化和操作电子表格数据:
实现一个支持绘制 Excel 电子表格选定列的界面。
将 MATLAB 图窗插入 Excel 文件中。
使用以下代码创建函数 actx_excel.m。
注意
要访问此示例中的数据文件 input_resp_data.xls,您必须安装此文档。
创建 Excel 自动化服务器
通过 MATLAB 访问电子表格数据的第一步是使用 actxserver 函数和程序 ID excel.application 在自动化服务器进程中运行 Excel 应用程序。
exl = actxserver('excel.application');exl 对象提供了对 Excel 程序所支持的多个接口的访问权限。使用 Workbooks 接口打开包含数据的 Excel 文件。
exlWkbk = exl.Workbooks;
exlFile = exlWkbk.Open([docroot '/techdoc/matlab_external/examples/input_resp_data.xls']);
使用 workbook 的 Sheets 接口访问来自 Range 对象的数据,该对象存储了对指定工作表内某个数据范围的引用。此示例访问从列 A 中的第一个单元格到列 G 中的最后一个单元格的所有数据。
exlSheet1 = exlFile.Sheets.Item('Sheet1');
robj = exlSheet1.Columns.End(4);       % Find the end of the column
numrows = robj.row;                    % And determine what row it is
dat_range = ['A1:G' num2str(numrows)]; % Read to the last row
rngObj = exlSheet1.Range(dat_range);
此时,将通过 range 对象接口 rngObj 访问来自 Excel 文件的 sheet1 的整个数据集。此对象将在 MATLAB 元胞数组 exlData 中返回数据,该元胞数组同时包含数值和字符数据:
exlData = rngObj.Value;
操作 MATLAB 工作区中的数据
现在数据在元胞数组中,您可以使用 MATLAB 函数提取部分数据并将其重构,以在界面中使用和传递给绘图函数。有关数据的假设,请参阅 Excel 电子表格格式。
以下代码用于操作数据:
for ii = 1:size(exlData,2)
   matData(:,ii) = reshape([exlData{2:end,ii}],size(exlData(2:end,ii)));
   lBoxList{ii} = [exlData{1,ii}];
end
该代码执行以下操作:
从元胞数组中提取数值数据。请查看花括号
{}内的索引表达式。串联索引操作返回的各个双精度值。请查看方括号
[]内的表达式。使用
reshape函数将结果重构为数组,该数组将数据排列在各个列中。提取每一列
exlData数据的第一个单元格中的文本,并将文本存储在元胞数组lBoxList中。此变量用于生成列表框中的项目。
Excel 电子表格格式
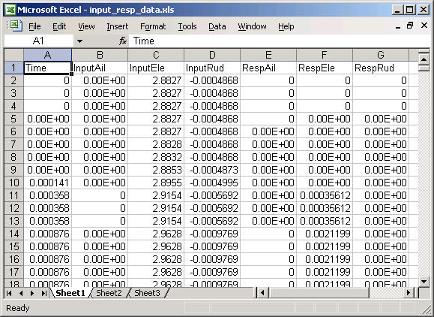
此示例假设 Excel 电子表格具有此图所示的特定组织方式。

该 Excel 文件的格式为:
每一列的第一个元素是用于标识该列中所含数据的文本。这些值被提取并用于填充列表框。
第一列
Time用于其余所有数据绘图的 x 轴。每个列中的所有行都将读入 MATLAB。
创建绘图函数界面
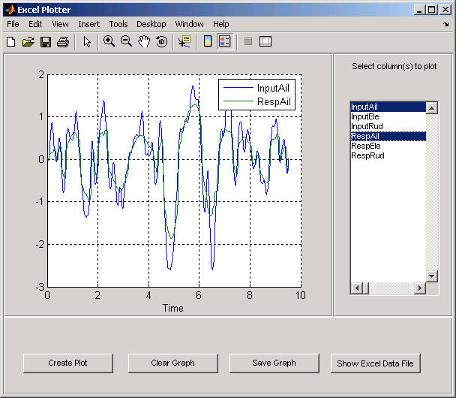
此示例使用一个界面,使您能够从输入和响应数据的列表中进行选择。所有数据都绘制为时间的函数,并且您可以继续向图中添加更多数据。添加到图形中的每个数据绘图都会使得图例也随之扩展。
该界面包括下列细节:
在您向图中添加数据时会更新的图例
用于从坐标区中清除所有图的清除按钮
用于将图保存为 PNG 文件并将其添加到另一个 Excel 文件的保存按钮
用于显示或隐藏当前所访问的 Excel 文件的切换按钮
用于终止自动化服务器的图窗删除功能
选择并绘制数据
当您点击 Create Plot 按钮时,其回调函数将查询列表框,以确定选中了哪些项目并绘制每个数据对时间的图。MATLAB 会更新图例以显示新数据,同时仍保留现有数据的图例。
function plotButtonCallback(src,evnt)
iSelected = get(listBox,'Value');
grid(a,'on');hold on
for p = 1:length(iSelected)
   switch iSelected(p)
      case 1
         plot(a,tme,matData(:,2))
      case 2
         plot(a,tme,matData(:,3))
      case 3
         plot(a,tme,matData(:,4))
      case 4
         plot(a,tme,matData(:,5))
      case 5
         plot(a,tme,matData(:,6))
      case 6
         plot(a,tme,matData(:,7))
      otherwise
         disp('Select data to plot')
   end
end
[b,c,g,lbs] = legend([lbs lBoxList(iSelected+1)]);
end % plotButtonCallback
清空坐标区
此绘图函数设计为当用户从列表框中选择数据时可持续添加图形。Clear Graph 按钮将清空并重置坐标区,并清除用于存储绘图数据标签(供图例使用)的变量。
%% Callback for clear button
function clearButtonCallback(src,evt)
   cla(a,'reset')
   lbs = '';
end % clearButtonCallback
显示或隐藏 Excel 文件
MATLAB 程序可访问在自动化服务器中运行的 Excel 应用程序的属性。通过将 Visible 属性设为 1 或 0,此回调可控制 Excel 文件的可见性。
%% Display or hide Excel file
function dispButtonCallback(src,evt)
   exl.visible = get(src,'Value');
end % dispButtonCallback
关闭图窗并终止 Excel 自动化进程
由于 Excel 自动化服务器在 MATLAB 以外的单独进程中运行,因此您必须显式终止此进程。关闭界面后,没有必要再让此进程保持运行状态,因此该示例通过 Quit 方法,使用图窗的 delete 函数来终止 Excel 进程。您还需要终止用于保存图的 Excel 进程。有关终止此进程的信息,请参阅将 MATLAB 图插入 Excel 电子表格。
%% Terminate Excel processes
function deleteFig(src,evt)
   exlWkbk.Close
   exlWkbk2.Close
   exl.Quit
   exl2.Quit
end % deleteFig
将 MATLAB 图插入 Excel 电子表格
您可以在 Excel 文件中保存使用此界面创建的图。本示例使用一个单独的 Excel 自动化服务器进程来实现此目的。Save Graph 普通按钮的回调将创建图像并将其添加到 Excel 文件:
如屏幕中所见,坐标区和图例都被复制到一个配置为打印图形的不可见图窗(图窗的
PaperPositionMode属性被设为auto)。print命令可创建 PNG 图像。使用
Shapes接口将图像插入 Excel 工作簿。
服务器和接口均在初始化阶段进行实例化:
exl2 = actxserver('excel.application');
exlWkbk2 = exl2.Workbooks;
wb = invoke(exlWkbk2,'Add');
graphSheet = invoke(wb.Sheets,'Add');
Shapes = graphSheet.Shapes;
使用以下代码实现 Save Graph 按钮回调:
function saveButtonCallback(src,evt)
   tempfig = figure('Visible','off','PaperPositionMode','auto');
   tempfigfile = [tempname '.png'];
   ah = findobj(f,'type','axes');
   copyobj(ah,tempfig) % Copy both graph axes and legend axes
   print(tempfig,'-dpng',tempfigfile);
   Shapes.AddPicture(tempfigfile,0,1,50,18,300,235);
   exl2.visible = 1;
end
运行示例
要运行该示例,请选择列表框中的任意项目,然后点击 Create Plot 按钮。此示例提供的示例数据包含三个输入和三个关联的响应数据集。在该示例中,绘制所有这些数据集对 Excel 文件中的第一列(即时间数据)的图。
通过点击 Show Excel Data File 按钮查看 Excel 数据文件。要将图形图像保存在另一个 Excel 文件中,请点击 Save Graph 按钮。如果您在当前文件夹中拥有写访问权限,则 Save Graph 选项将在该文件夹中创建一个临时 PNG 文件。
界面如下图所示,列表框中的输入/响应对组为选中状态,坐标区则显示相应绘图。

