定义接口超类
接口
类定义的属性和方法构成接口,该接口决定类用户如何与类的对象交互。创建一组相关类时,接口定义所有这些类的公共接口。接口的实际实现可能因类而异。
以一组设计用于表示各种图形类型的类为例。所有类都必须实现 Data 属性,以包含用于生成图形的数据。然而,对于不同类型的图形,数据的形式可能有很大不同。每个类可以通过不同方式实现 Data 属性。
对于方法,也存在同样的差异。所有类都可以有一个创建图形的 draw 方法,但是,该方法的实现会根据图形的类型而变化。
接口类的基本思想是指定每个子类必须实现的属性和方法,而不定义实际实现。这种方式使您能够对一组相关对象强制实施一致的接口。在将来添加更多的类时,接口始终保持不变。
接口类实现图
此示例为用于表示特化图形的类创建一个接口。接口是抽象类,它定义子类必须实现的属性和方法,但不指定如何实现这些组件。
这种方式强制实施一致的接口,同时提供必要的灵活性来以不同方式实现每个特化子类的内部工作。
在本示例中,命名空间文件夹包含接口、派生的子类和工具函数:
+graphics/GraphInterface.m  % abstract interface class
+graphics/LineGraph.m       % concrete subclass
接口的属性和方法
GraphInterface 类指定以下属性,子类必须定义这些属性:
Primitive- 用于实现特化图形的图形对象的句柄。类用户不需要直接访问这些对象,因此该属性具有protectedSetAccess和GetAccess。AxesHandle- 用于图形的坐标区的句柄。特化graph对象可以设置坐标区对象属性。该属性具有protectedSetAccess和GetAccess。Data-GraphInterface类的所有子类都必须存储数据。数据的类型各不相同,每个子类都定义存储机制。子类用户可以更改数据值,因此该属性具有公共访问权限。
GraphInterface 类命名子类必须实现的三个抽象方法。GraphInterface 类还在注释中建议每个子类构造函数必须接受所有类属性的绘图数据和属性名称/属性值对组。
子类构造函数 - 接受数据和 P/V 对组并返回对象。
draw- 用于创建绘图基元,并根据子类实现的图形类型渲染数据的图形。zoom- 通过更改坐标区CameraViewAngle属性来实现 zoom 方法。该接口推荐使用camzoom函数来实现子类之间的一致性。由addButtons静态方法创建的缩放按钮使用此方法作为回调。updateGraph-set.Data方法调用的方法,用于在Data属性发生变化时更新绘图数据。
接口决定类设计
从 GraphInterface 抽象类派生的类命名空间实现以下行为:
创建特化
GraphInterface对象(子类对象)的实例,而不渲染绘图在创建特化
GraphInterface对象时,指定任一或不指定任何对象属性更改任一对象属性都会自动更新当前显示的绘图
允许每个特化
GraphInterface对象实现它需要的任何附加属性,以便让类用户控制这些特性。
定义接口
GraphInterface 类是抽象类,用于定义子类使用的方法和属性。抽象类中的注释说明预期的实现:
classdef GraphInterface < handle
   % Abstract class for creating data graphs
   % Subclass constructor should accept
   % the data that is to be plotted and
   % property name/property value pairs
   properties (SetAccess = protected, GetAccess = protected)
      Primitive
      AxesHandle
   end
   properties
      Data
   end
   methods (Abstract)
      draw(obj)
      % Use a line, surface,
      % or patch graphics primitive
      zoom(obj,factor)
      % Change the CameraViewAngle
      % for 2D and 3D views
      % use camzoom for consistency
      updateGraph(obj)
      % Update the Data property and
      % update the drawing primitive
   end

   methods
      function set.Data(obj,newdata)
         obj.Data = newdata;
         updateGraph(obj)
      end
      function addButtons(gobj)
         hfig = get(gobj.AxesHandle,'Parent');
         uicontrol(hfig,'Style','pushbutton','String','Zoom Out',...
            'Callback',@(src,evnt)zoom(gobj,.5));
         uicontrol(hfig,'Style','pushbutton','String','Zoom In',...
            'Callback',@(src,evnt)zoom(gobj,2),...
            'Position',[100 20 60 20]);
      end
   end
end
GraphInterface 类实现属性 set 方法 (set.Data) 以监控 Data 属性的更改。另一种方式是将 Data 属性定义为 Abstract,并使子类能够确定是否为此属性实现 set 访问方法。GraphInterface 类定义一个调用抽象方法(updateGraph,每个子类都必须实现该方法)的 set 访问方法。GraphInterface 接口为整个类命名空间施加特定设计,而不会限制灵活性。
用于所有子类的方法
addButtons 方法为 zoom 方法添加普通按钮,每个子类都必须实现这些方法。通过使用方法而不是普通函数,可使 addButtons 能够访问受保护的类数据(坐标区句柄)。使用对象 zoom 方法作为普通按钮回调。
function addButtons(gobj)
   hfig = get(gobj.AxesHandle,'Parent');
   uicontrol(hfig,'Style','pushbutton',...
      'String','Zoom Out',...
      'Callback',@(src,evnt)zoom(gobj,.5));
   uicontrol(hfig,'Style','pushbutton',...
      'String','Zoom In',...
      'Callback',@(src,evnt)zoom(gobj,2),...
      'Position',[100 20 60 20]);
end
派生具体类 - LineGraph
此示例只定义一个用于表示简单线图的子类。它派生自 GraphInterface,但提供对抽象方法 draw、zoom、updateGraph 及其自己的构造函数的实现。基类 GraphInterface 和子类都包含在命名空间 (graphics) 中,您必须使用它来引用类名:
classdef LineGraph < graphics.GraphInterface添加属性
LineGraph 类实现在 GraphInterface 类中定义的接口,并添加两个附加属性 - LineColor 和 LineType。此类为每个属性定义初始值,因此在构造函数中指定属性值是可选的。您可以创建没有数据的 LineGraph 对象,但无法从该对象生成图形。
properties
   LineColor = [0 0 0];
   LineType = '-';
end
LineGraph 构造函数
构造函数接受 struct 及 x 和 y 坐标数据,以及属性名称/属性值对组:
function gobj = LineGraph(data,varargin)
   if nargin > 0
      gobj.Data = data;
      if nargin > 2
         for k=1:2:length(varargin)
            gobj.(varargin{k}) = varargin{k+1};
         end
      end
   end
end
实现 draw 方法
LineGraph 的 draw 方法使用属性值创建一个 line 对象。LineGraph 类将 line 句柄存储为受保护的类数据。为了支持类构造函数不使用输入参量,draw 会在继续之前检查 Data 属性以确定它是否为空:
function gobj = draw(gobj)
   if isempty(gobj.Data)
      error('The LineGraph object contains no data')
   end
   h = line(gobj.Data.x,gobj.Data.y,...
      'Color',gobj.LineColor,...
      'LineStyle',gobj.LineType);
   gobj.Primitive = h;
   gobj.AxesHandle = get(h,'Parent');
end
实现 zoom 方法
LineGraph 的 zoom 方法使用 GraphInterface 类的注释中推荐的 camzoom 函数。camzoom 提供方便的接口来支持缩放功能,并使用 addButtons 方法创建的普通按钮以正确进行操作。
定义属性 set 方法
通过属性 set 方法,可以方便地在构造函数中首次更改属性值时自动执行代码。(请参阅属性 get 和 set 方法。)每当属性值更改时,linegraph 类都会使用 set 方法更新 line 原始数据(这会导致绘图重绘)。使用属性 set 方法可以快速更新数据图,而无需调用 draw 方法。draw 方法通过重置所有值为当前属性值来更新绘图。
三个属性使用 set 方法:LineColor、LineType 和 Data。LineColor 和 LineType 是由 LineGraph 类添加的属性,并且是该类使用的 line 基元特有的属性。其他子类可以定义对其特化所独有的不同属性(例如,FaceColor)。
GraphInterface 类实现 Data 属性 set 方法。但是,GraphInterface 类要求每个子类定义名为 updateGraph 的方法,该方法处理所使用的特定绘图基元的绘图数据更新。
LineGraph 类
以下是 LineGraph 类定义。
classdef LineGraph < graphics.GraphInterface
   properties
      LineColor = [0 0 0]
      LineType = '-'
   end

   methods
      function gobj = LineGraph(data,varargin)
         if nargin > 0
            gobj.Data = data;
            if nargin > 1
               for k=1:2:length(varargin)
                  gobj.(varargin{k}) = varargin{k+1};
               end
            end
         end
      end

      function gobj = draw(gobj)
         if isempty(gobj.Data)
            error('The LineGraph object contains no data')
         end
         h = line(gobj.Data.x,gobj.Data.y,...
            'Color',gobj.LineColor,...
            'LineStyle',gobj.LineType);
         gobj.Primitive = h;
         gobj.AxesHandle = h.Parent;
      end

      function zoom(gobj,factor)
         camzoom(gobj.AxesHandle,factor)
      end

      function updateGraph(gobj)
         set(gobj.Primitive,...
            'XData',gobj.Data.x,...
            'YData',gobj.Data.y)
      end

      function set.LineColor(gobj,color)
         gobj.LineColor = color;
         set(gobj.Primitive,'Color',color)
      end

      function set.LineType(gobj,ls)
         gobj.LineType = ls;
         set(gobj.Primitive,'LineStyle',ls)
      end
   end
end
使用 LineGraph 类
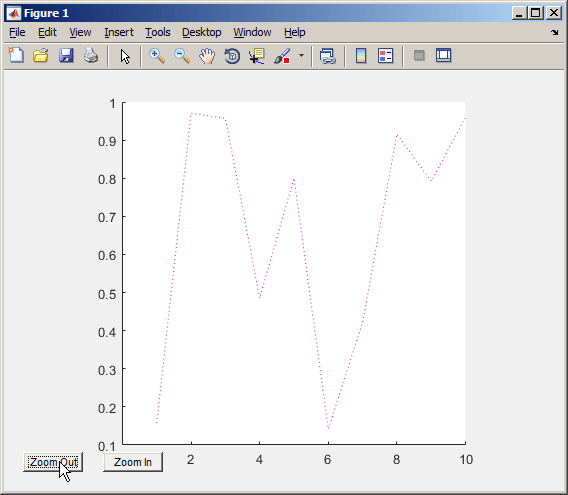
LineGraph 类定义由 graph 基类指定的简单 API,并实现其特化类型的图形:
d.x = 1:10;
d.y = rand(10,1);
lg = graphics.LineGraph(d,'LineColor','b','LineType',':');
lg.draw;
lg.addButtons;
点击放大按钮会显示为该按钮提供回调的 zoom 方法。

更改属性会更新图形:
d.y = rand(10,1);
lg.Data = d;
lg.LineColor = [0.9,0.1,0.6];
现在点击缩小并查看新结果:
