使用实时编辑器创建实时仪表板
在实时编辑器中,您可以创建仪表板来显示和分析实时数据。创建这些仪表板时,您可以使用按钮按需检索和显示实时数据,并使用其他交互式控件来修改显示的数据。要仅向仪表板用户显示格式化文本、控件和结果,请隐藏代码。
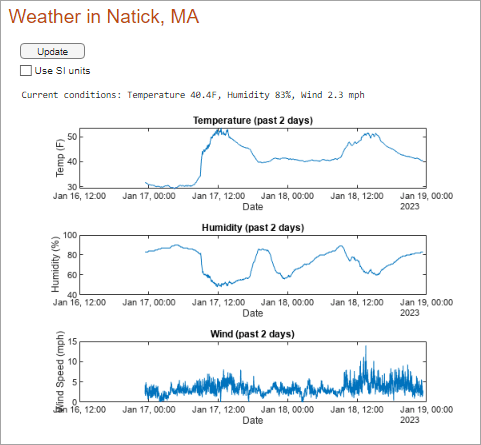
此示例说明如何在实时编辑器中创建一个简单的天气仪表板。该仪表板使用按钮和复选框来获取和显示实时天气数据。
要查看天气仪表板并与之交互,请在 MATLAB® 中打开此示例。
创建仪表板
您可以通过在 MATLAB 中打开此示例来打开天气仪表板的副本。要自己重新创建该仪表板,请创建一个名为 WeatherDashboard.m 的实时脚本。然后,添加描述性文本和代码,配置控件,并隐藏代码。
添加代码
复制天气仪表板代码一节中的描述性文本和代码,以获取并显示来自 ThingSpeak™ 通道 12397 的实时数据。此通道可从马萨诸塞州内蒂克市的 Arduino 气象站收集天气数据。
配置控件
该仪表板使用按钮来更新显示的天气数据,并使用复选框来切换使用的单位。
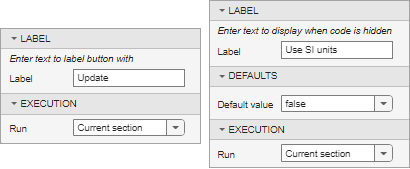
在您复制代码时,控件将被替换为其当前值。要将控件添加回代码中,请在实时脚本的开头插入一个按钮,并用一个复选框替换 useSIUnits 变量。然后,对控件进行配置,具体方法是右键点击控件,选择配置控件,并按如下所述指定控件选项:
按钮 - 将标签设置为
Update,并将运行执行选项设置为Current section。当用户按下该按钮时,当前节中的代码会运行,从而更新仪表板中显示的天气数据。复选框 - 将标签设置为
Use SI units,并将运行执行选项设置为Current section。当用户选中或清除该复选框时,显示的天气数据会更新以显示所选单位。
隐藏代码
要在隐藏代码并仅显示控件和结果的情况下以仪表板形式查看示例,请转至视图选项卡,然后点击隐藏代码。现在,用户可以通过点击按钮获取天气更新并切换复选框来更改单位,与仪表板进行交互。实时编辑器根据用户提供的输入检索和显示天气数据。
天气仪表板代码
本节提供 WeatherDashboard.m 实时脚本文件的完整内容,包括描述性文本、代码和示例输出。
马萨诸塞州内蒂克市的天气
data = thingSpeakRead(12397,NumPoints=1000,Timeout=10,OutputFormat='TimeTable');
latestValues = height(data);

useSIUnits = false;

if useSIUnits == 0
    disp("Current conditions: Temperature " + data.TemperatureF(latestValues) + ...
        "F, Humidity " + data.Humidity(latestValues) + "%, Wind " + ...
        data.WindSpeedmph(latestValues) + " mph")

    plotWeatherData(data.Timestamps,data.TemperatureF,"F",data.WindSpeedmph, ...
        "mph",data.Humidity)

else
    tempC = (5/9)*(data.TemperatureF-32);
    tempC = round(tempC,2);

    windkmh = data.WindSpeedmph*1.60934;
    disp("Current conditions: Temperature " + tempC(latestValues) + "C, Humidity " + ...
        data.Humidity(latestValues) + "%, Wind " + windkmh(latestValues) + "vkph")

    plotWeatherData(data.Timestamps,tempC,"C",windkmh,"kph",data.Humidity)
end
Current conditions: Temperature 0.1F, Humidity 0%, Wind 1.9 mph
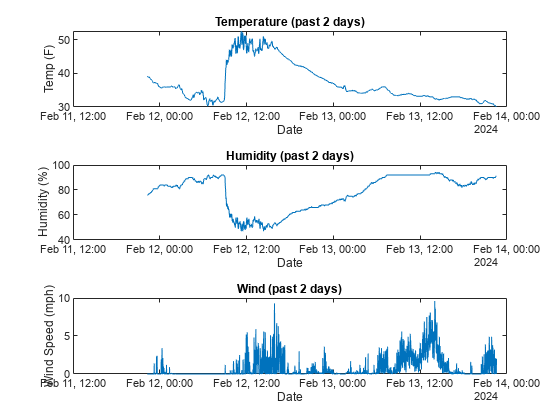
function plotWeatherData(timestamps,tempData,tempUnits,windData,windUnits,humidityData)
    tiledlayout(3,1);

    nexttile
    plot(timestamps,tempData)
    xlabel("Date")
    ylabel("Temp (" + tempUnits + ")")
    title("Temperature (past 1000 data readings)")

    nexttile
    plot(timestamps,humidityData)
    xlabel("Date")
    ylabel("Humidity (%)")
    title("Humidity (past 1000 data readings)")

    nexttile
    plot(timestamps,windData)
    xlabel("Date")
    ylabel("Wind Speed (" + windUnits + ")")
    title("Wind (past 1000 data readings)")
end