colormaplist
说明
cmaps = colormaplist 以 m×1 字符串数组形式返回可用颜色图的列表。
示例
返回颜色图列表。
cmaps = colormaplist
cmaps =

  21×1 string array

    "parula"
    "turbo"
    "hsv"
    "hot"
    "cool"
    "spring"
    "summer"
    "autumn"
    "winter"
    "gray"
...创建一个函数,该函数返回在特定颜色图中定义的 RGB 三元组。
返回颜色图列表。
cmaps = colormaplist
cmaps =

  21×1 string array

    "parula"
    "turbo"
    "hsv"
    "hot"
    "cool"
    "spring"
    "summer"
    "autumn"
    "winter"
    "gray"
    ...
使用 str2func 定义一个函数,该函数返回 turbo 颜色图中的前 n 个 RGB 三元组。
cmapFcn = str2func(cmaps(2))
cmapFcn =

  function_handle with value:

    @turbo
使用 cmapFcn 列出 turbo 中的前五个 RGB 三元组。
cmapFcn(5)
ans =

    0.1900    0.0718    0.2322
    0.1602    0.7332    0.9252
    0.6384    0.9910    0.2365
    0.9853    0.5018    0.1324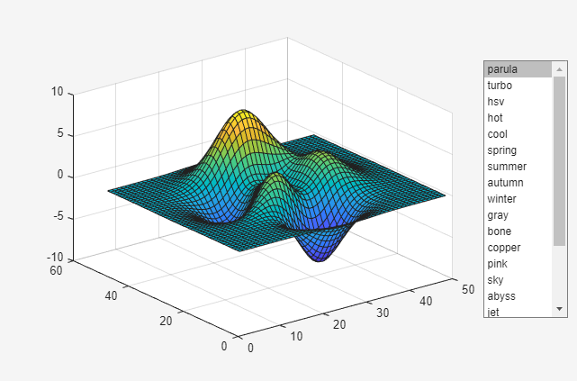
0.4796 0.0158 0.0106plotwithcolormaps 函数创建一个坐标区对象并在坐标区中绘制曲面。该函数还创建一个列表框,并使用调用 colormaplist 的结果来填充该列表。
function plotwithcolormaps
    f = uifigure;
    ax = axes(f,Units="pixels",Position=[180 100 500 400]);
    cmaps = colormaplist;
    uilistbox(f,Position=[750 200 120 320],Items=cmaps,...
        ValueChangedFcn=@applycmap);
    surf(ax,peaks)

    function applycmap(src,~)
        colormap(src.Parent,src.Value)
    end
end
保存并运行 plotwithcolormaps。通过从列表框中选择选项来更改图的颜色图。
plotwithcolormaps
版本历史记录
在 R2025a 中推出