lines
线条颜色图数组

说明

示例
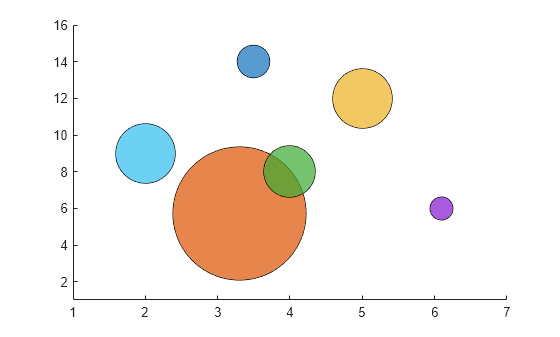
使用默认颜色创建散点图。
x = [3.5 3.3 5 6.1 4 2];
y = [14 5.7 12 6 8 9];
sz = 100*[6 100 20 3 15 20];
c = [1 2 3 4 5 6];
scatter(x,y,sz,c,'filled','MarkerEdgeColor','k','MarkerFaceAlpha',.7);
xlim([1 7]);
ylim([1 16]);
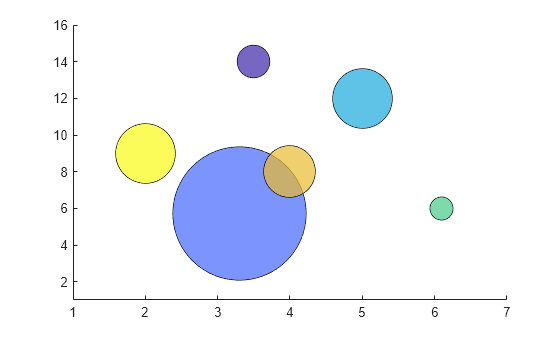
获取具有六个条目的线条颜色图数组。然后替换散点图中的颜色图。
c = lines(6);
colormap(c);