plot
说明
输入参数
示例
将编译计划中的任务绘制为依赖关系图。
打开示例,然后导航到 plot_plan_example 文件夹,其中包含一个编译文件以及两个名为 explore.c 和 yprime.c 的 C 源文件。
cd plot_plan_example以下代码显示编译文件的内容:
"clean"任务删除编译文件中其他任务的输出和跟踪。"mex"任务组包含两个名为"mex:explore"和"mex:yprime"的任务。这些任务中的每个任务都将一个源文件编译为 MEX 文件,并将结果保存到当前文件夹中名为output的文件夹中。要运行"mex"任务组,系统上必须安装支持的 C 编译器。"archive"任务创建其输入的存档。
function plan = buildfile
import matlab.buildtool.tasks.CleanTask
import matlab.buildtool.tasks.MexTask

% Create a plan from task functions
plan = buildplan(localfunctions);

% Add a task to delete outputs and traces
plan("clean") = CleanTask;

% Add a task group to build MEX files
plan("mex:explore") = MexTask("explore.c","output");
plan("mex:yprime") = MexTask("yprime.c","output");

plan("mex").Description = "Build MEX files";

% Specify the inputs and outputs of the "archive" task
plan("archive").Inputs = [plan("mex").Tasks.MexFile];
plan("archive").Outputs = "mex.zip";
end

function archiveTask(context)
% Create ZIP file
task = context.Task;
zip(task.Outputs.paths,task.Inputs.paths)
end
从编译文件中加载一个计划。
plan = buildfile
plan =
  Plan with tasks:

    archive - Create ZIP file
    clean   - Delete task outputs and traces
    mex     - Build MEX files

  Show all tasks
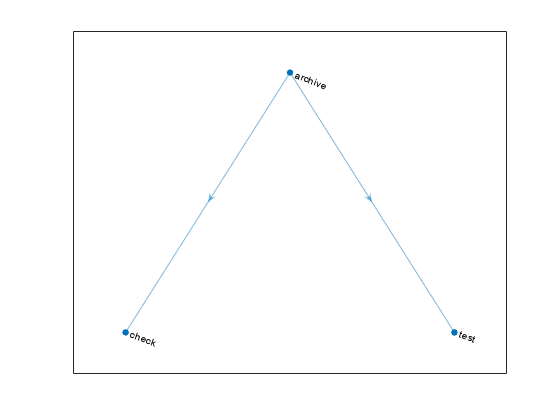
将该计划中的任务绘制为一个依赖关系图。该图将 "clean" 任务、"mex" 任务组和 "archive" 任务显示为节点。但是,它不包括 "mex" 任务组中的任务。由于 "archive" 任务的输入是 "mex" 任务组的输出,该图还包括一条边来表示这种依赖关系。
plot(plan)
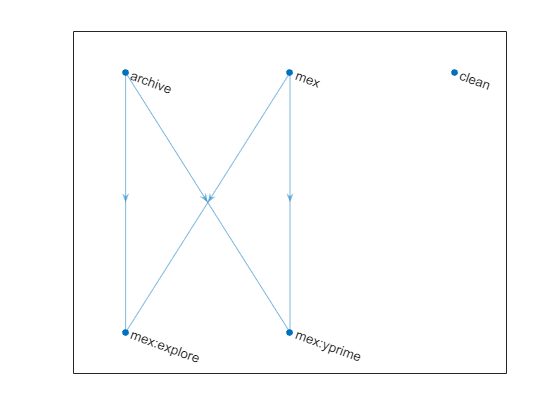
绘制计划中的所有任务,包括 "mex" 任务组中的 "mex:explore" 和 "mex:yprime" 任务。
plot(plan,ShowAllTasks=true)