matlab.graphics.chartcontainer.mixin.Legend 类
命名空间: matlab.graphics.chartcontainer.mixin
向图容器子类添加图例支持
描述
matlab.graphics.chartcontainer.mixin.Legend 类用于为从 matlab.graphics.chartcontainer.ChartContainer 继承的图添加图例支持。通过从此类继承,您可以在图中显示图例。您的用户可以选择图窗菜单栏或图窗工具栏中的选项来显示或隐藏该图例。
使用以下语法为您的图启用图例支持:
classdef MyChart < matlab.graphics.chartcontainer.ChartContainer & ...
                   matlab.graphics.chartcontainer.mixin.Legend
  ...
end
matlab.graphics.chartcontainer.mixin.Legend 类是一个 handle 类。
属性
方法
示例
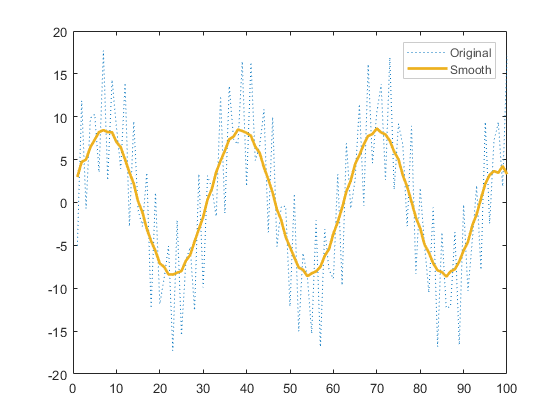
定义 SmoothLegendPlot 类,该类使用一条蓝色点线和该线条经过平滑处理的版本绘制一组数据。
要定义该类,请创建一个包含以下代码的、名为 SmoothLegendPlot.m 的文件。此类的 setup 方法执行以下任务:
创建两个
Line对象,为其指定恰当的DisplayName值,作为显示在图例中的名称将
LegendVisible属性设置为'on',使图例可见获取
Legend对象,并自定义文本颜色、框边缘颜色和框线宽度
classdef SmoothLegendPlot < matlab.graphics.chartcontainer.ChartContainer & ...
        matlab.graphics.chartcontainer.mixin.Legend

    properties
        XData (1,:) double = NaN
        YData (1,:) double = NaN
        SmoothColor (1,3) double {mustBeGreaterThanOrEqual(SmoothColor,0),...
            mustBeLessThanOrEqual(SmoothColor,1)} = [0.9290 0.6940 0.1250]
        SmoothWidth (1,1) double = 2
    end
    properties(Access = private,Transient,NonCopyable)
        OriginalLine (1,1) matlab.graphics.chart.primitive.Line
        SmoothLine (1,1) matlab.graphics.chart.primitive.Line
    end

    methods(Access = protected)
        function setup(obj)
            ax = getAxes(obj);

            % Create line objects. Define line styles and legend names.
            obj.OriginalLine = plot(ax,NaN,NaN,'LineStyle',':',...
                'DisplayName','Original');
            hold(ax,'on')
            obj.SmoothLine = plot(ax,NaN,NaN,...
                'DisplayName','Smooth');

            % Make legend visible
            obj.LegendVisible = 'on';

            % Get legend and set text color, edge color, and line width
            lgd = getLegend(obj);
            lgd.TextColor = [.3 .3 .3];
            lgd.EdgeColor = [.8 .8 .8];
            lgd.LineWidth = .7;
            hold(ax,'off')
        end
        function update(obj)
            % Update Line data
            obj.OriginalLine.XData = obj.XData;
            obj.OriginalLine.YData = obj.YData;
            obj.SmoothLine.XData = obj.XData;
            obj.SmoothLine.YData = createSmoothData(obj);

            % Adjust smooth line appearance
            obj.SmoothLine.LineWidth = obj.SmoothWidth;
            obj.SmoothLine.Color = obj.SmoothColor;
        end
        function sm = createSmoothData(obj)
            % Calculate smoothed data
            v = ones(1,10)*0.1;
            sm = conv(obj.YData,v,'same');
        end
    end
end
接下来,创建一对 x 和 y 向量。调用从 ChartContainer 类继承的 SmoothLegendPlot 构造函数方法,绘制 x 和 y 的图。指定 'XData' 和 'YData' 名称-值对组参量,并以 c 形式返回图对象。
x = 1:1:100;
y = 10*sin(x./5)+8*sin(10.*x+0.5);
c = SmoothLegendPlot('XData',x,'YData',y);
使用 c 将平滑线的颜色更改为红色。请注意,图例也会显示新的线条颜色。
c.SmoothColor = [1 0 0];

版本历史记录
在 R2019b 中推出