comparisonPlot
类: matlab.perftest.TimeResult
命名空间: matlab.perftest
创建绘图来比较基线和测量测试结果
语法
说明
cp = comparisonPlot( 使用最小样本测量时间创建一个绘图,直观地比较 baseline,measurement)baseline 和 measurement 数组中的每个 TimeResult 对象。该方法将比较图以 matlab.unittest.measurement.chart.ComparisonPlot 对象形式返回。
cp = comparisonPlot( 使用指定的统计量创建一个比较图。baseline,measurement,stat)
cp = comparisonPlot(___, 支持上述语法中的任何输入参量组合,且可使用一个或多个名称-值参量指定选项。例如,Name,Value)cp = comparisonPlot(baseline,measurement,"Scale","linear") 使用带线性刻度的 x 轴和 y 轴创建一个绘图。
输入参数
名称-值参数
示例
可视化两种排序算法(气泡排序和合并排序)的计算复杂度,这两种算法按升序对列表元素进行排序。气泡排序是一种简单的排序算法,它重复遍历列表,比较相邻的一对元素,并在元素顺序错误时交换元素。合并排序是一种“分而治之”的算法,它将排序的子列表合并为新排序列表,利用了这一机制的便捷性。
在当前文件夹中名为 bubbleSort.m 的文件中,创建 bubbleSort 函数,该函数实现气泡排序算法。
function y = bubbleSort(x)
% Sorting algorithm with O(n^2) complexity
n = length(x);
swapped = true;

while swapped
    swapped = false;
    for i = 2:n
        if x(i-1) > x(i)
            temp = x(i-1);
            x(i-1) = x(i);
            x(i) = temp;
            swapped = true;
        end
    end
end

y = x;
end
在当前文件夹中名为 mergeSort.m 的文件中,创建 mergeSort 函数,该函数实现合并排序算法。
function y = mergeSort(x)
% Sorting algorithm with O(n*logn) complexity
y = x;  % A list of one element is considered sorted

if length(x) > 1
    mid = floor(length(x)/2);
    L = x(1:mid);
    R = x((mid+1):end);

    % Sort left and right sublists recursively
    L = mergeSort(L);
    R = mergeSort(R);

    % Merge the sorted left (L) and right (R) sublists
    i = 1;
    j = 1;
    k = 1;
    while i <= length(L) && j <= length(R)
        if L(i) < R(j)
            y(k) = L(i);
            i = i + 1;
        else
            y(k) = R(j);
            j = j + 1;
        end
        k = k + 1;
    end

    % At this point, either L or R is empty
    while i <= length(L)
        y(k) = L(i);
        i = i + 1;
        k = k + 1;
    end

    while j <= length(R)
        y(k) = R(j);
        j = j + 1;
        k = k + 1;
    end
end

end
在当前文件夹中名为 SortTest.m 的文件中,创建 SortTest 参数化测试类,该类比较气泡排序和合并排序算法的性能。该类的 len 属性包含要用于测试的列表元素的数量。
classdef SortTest < matlab.perftest.TestCase
    properties
        Data
        SortedData
    end

    properties (ClassSetupParameter)
        % Create 25 logarithmically spaced values between 10^2 and 10^4
        len = num2cell(round(logspace(2,4,25)));
    end

    methods (TestClassSetup)
        function ClassSetup(testCase,len)
            orig = rng;
            testCase.addTeardown(@rng,orig)
            rng("default")
            testCase.Data = rand(1,len);
            testCase.SortedData = sort(testCase.Data);
        end
    end

    methods (Test)
        function testBubbleSort(testCase)
            while testCase.keepMeasuring
                y = bubbleSort(testCase.Data);
            end
            testCase.verifyEqual(y,testCase.SortedData)
        end

        function testMergeSort(testCase)
            while testCase.keepMeasuring
                y = mergeSort(testCase.Data);
            end
            testCase.verifyEqual(y,testCase.SortedData)
        end
    end
end
对所有对应于 testBubbleSort 方法的测试运行性能测试,并将结果保存在 baseline 数组中。您的结果可能与所示的结果不同。
baseline = runperf("SortTest","ProcedureName","testBubbleSort");
Running SortTest
.......... .......... .......... .......... ..........
.......... .......... .......... .......... ..........
.......... .......... .......... .......... ..........
.......... .......... .......... .......... ..........
.......... .......... .......... .......... ..........
.......... .......... .......... .......... ..
Done SortTest
__________
对所有对应于 testMergeSort 方法的测试运行性能测试,并将结果保存在 measurement 数组中。
measurement = runperf("SortTest","ProcedureName","testMergeSort");
Running SortTest
.......... .......... .......... .......... ..........
.......... .......... .......... .......... ..........
.......... .......... .......... .......... ..........
.......... .......... .......... .......... ..........
.......... .......... .......... .......... ..........
.......... .......... .......... .......... ..........
.......... .......... .......... .......... ..........
.......... .......... .......... .......... ..........
.......... .......... .......... .......... ..........
.......... .......... .......... .......... ..........
.......... .......... .......... .......... ..........
.......... .......... .......... .......... ..........
.......... .......... .......... .......... ..........
.......... .......... .......... .......... ..........
.......... .......... .......... .......... ..........
.......... .......... .......... .......... ..........
.......... .....
Done SortTest
__________
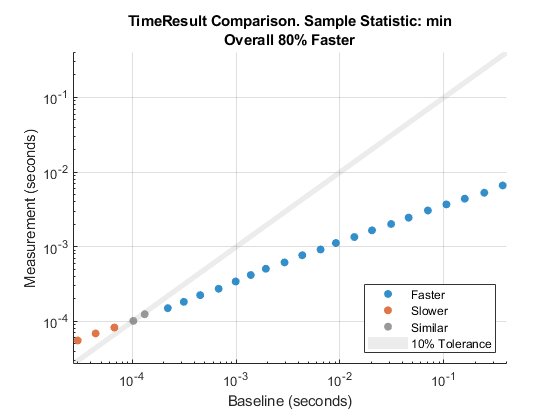
对于每组 baseline 和 measurement 对象,直观地比较其 Samples 表中对应 MeasuredTime 列的最小值。在此比较图中,大部分数据点为蓝色,因为它们位于阴影区域(表示相似)的下方。此结果表明,对于大多数测试来说,合并排序性能更优。但是,对于足够小的列表,气泡排序相比合并排序表现相当或更好,如图中橙色和灰色点所示。作为比较汇总,该图报告合并排序比气泡排序快 80%。该值是对应于所有数据点的提升百分比的几何均值。
cp = comparisonPlot(baseline,measurement);
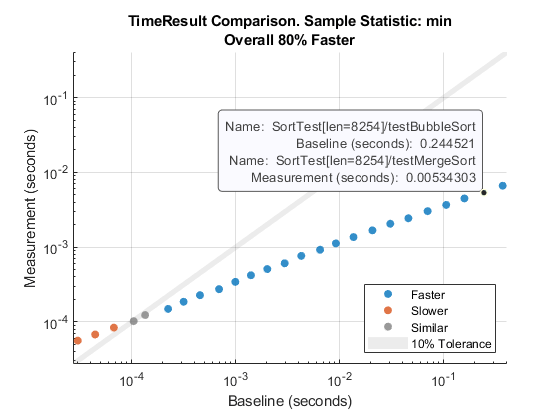
您可以用鼠标点击或指向任何数据点,进一步了解正在比较的时间测量结果。
要研究不同列表长度下的最差情形排序算法性能,请根据样本测量时间的最大值创建比较图。
cp = comparisonPlot(baseline,measurement,"max");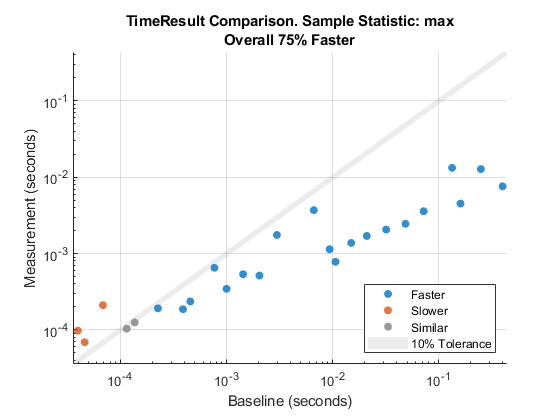
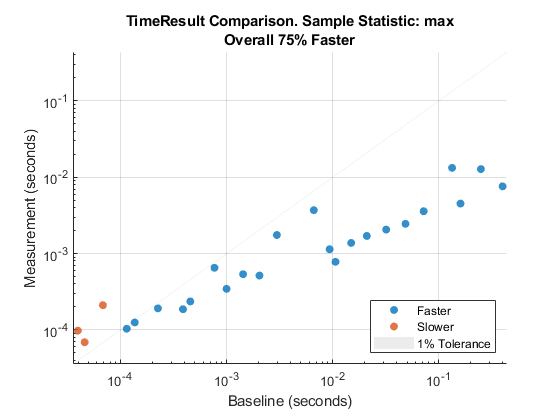
在比较样本测量时间的最大值时,将相似性容差减少到 0.01。
cp = comparisonPlot(baseline,measurement,"max","SimilarityTolerance",0.01);
版本历史记录
在 R2019b 中推出