polarhistogram
极坐标中的直方图

语法
说明
向量和矩阵数据
表数据
其他选项
polarhistogram(___, 使用一个或多个名称-值参量指定其他选项。例如,您可以将 Name=Value)FaceAlpha 指定为一个介于 0 和 1 之间的标量值,从而使用半透明条形。
polarhistogram( 将在 pax,___)pax 指定的极坐标区(而不是当前坐标区)中绘制图形。
h = polarhistogram(___)Histogram 对象。在创建直方图之后可使用 h 对其进行修改。有关属性列表,请参阅 Histogram 属性。
示例
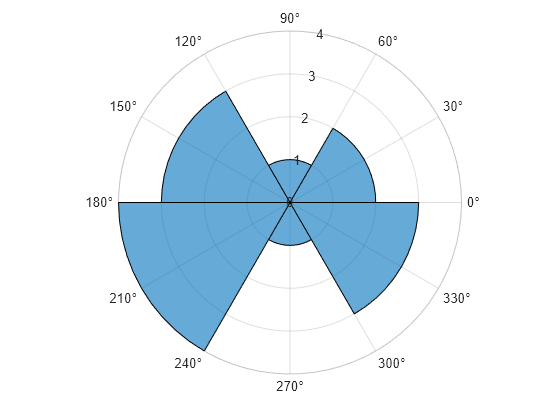
创建由介于 0 和 之间的值组成的向量。创建一个直方图,该直方图显示划分为六个 bin 的数据。
theta = [0.1 1.1 5.4 3.4 2.3 4.5 3.2 3.4 5.6 2.3 2.1 3.5 0.6 6.1];
polarhistogram(theta,6)
在 R2022a 之前,默认情况下极坐标区不包括度符号。要添加度符号,请使用 pax = gca 获取极坐标区。然后使用 pax.ThetaTickLabel = string(pax.ThetaTickLabel) + char(176) 修改刻度标签。
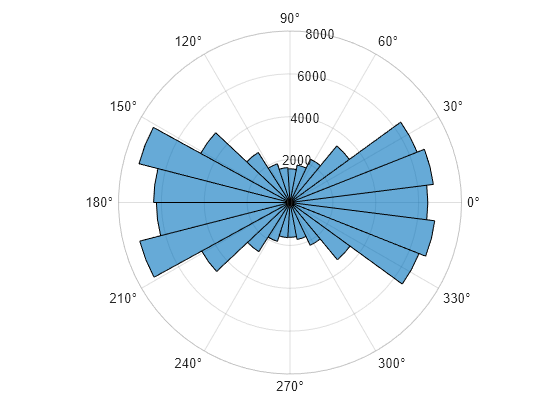
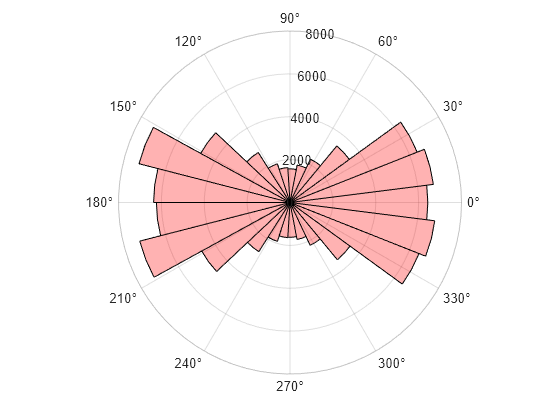
使用介于 和 之间的 100,000 个值创建一个直方图,然后将数据划分到 25 个 bin 中。
theta = atan2(rand(100000,1)-0.5,2*(rand(100000,1)-0.5));
polarhistogram(theta,25);
自 R2026a 起
创建一个表,其中包含名为 ThetaVals 的变量,该变量具有 14 个以弧度为单位的角度值。创建一个关于这些角度值的直方图。
ThetaVals = [0.1 1.1 5.4 3.4 2.3 4.5 3.2 3.4 5.6 2.3 2.1 3.5 0.6 6.1]';
tbl = table(ThetaVals);
polarhistogram(tbl,"ThetaVals")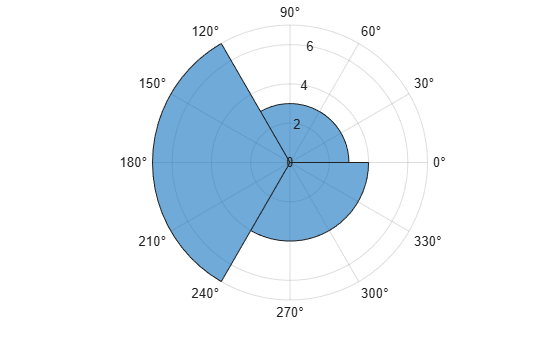
创建一个同一表变量的直方图,将数据划分到六个 bin 中。
polarhistogram(tbl,"ThetaVals",6)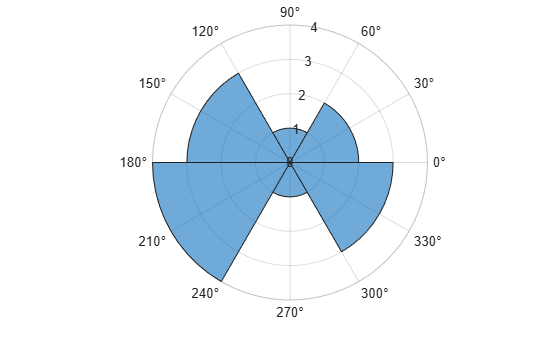
使用同一表变量,创建一个直方图并指定 bin 边界。
Edges = [0 0.5 1 1.5 2] * pi;
polarhistogram(tbl,"ThetaVals",Edges)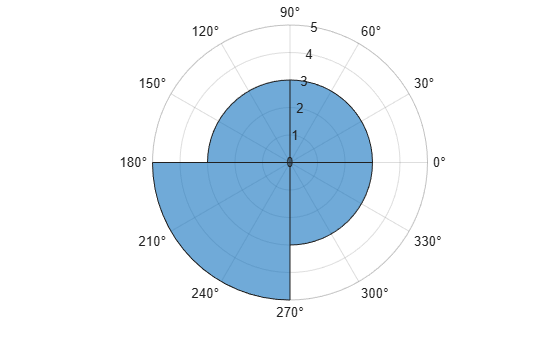
在极坐标中创建一个直方图,然后更改其外观。通过将 FaceColor 属性设置为颜色名称字符向量(例如 'red')或 RGB 三元组,指定条形的颜色。通过将 FaceAlpha 属性设置为介于 0 和 1 之间的值,指定透明度。
theta = atan2(rand(100000,1)-0.5,2*(rand(100000,1)-0.5));
polarhistogram(theta,25,'FaceColor','red','FaceAlpha',.3);
在极坐标中创建一个直方图。将直方图对象赋给变量 h。
theta = atan2(rand(100000,1)-0.5,2*(rand(100000,1)-0.5));
h = polarhistogram(theta,25)

h =
  Histogram with properties:

             Data: [100000×1 double]
           Values: [6232 7236 4699 2717 1908 1641 1622 1755 2207 3463 6471 6806 6429 6741 6380 3422 2233 1777 1570 1633 1899 2768 4755 7273 6363]
          NumBins: 25
         BinEdges: [-3.1416 -2.8903 -2.6389 -2.3876 -2.1363 -1.8850 -1.6336 -1.3823 -1.1310 -0.8796 -0.6283 -0.3770 -0.1257 0.1257 0.3770 0.6283 0.8796 1.1310 1.3823 1.6336 1.8850 2.1363 2.3876 2.6389 2.8903 3.1416]
         BinWidth: 0.2513
        BinLimits: [-3.1416 3.1416]
    Normalization: 'count'
        FaceColor: 'auto'
        EdgeColor: [0.1294 0.1294 0.1294]

  Show all properties
在创建直方图对象之后可使用 h 访问并修改其属性。例如,通过设置直方图对象的 DisplayStyle 属性,仅显示直方图的轮廓。
h.DisplayStyle = 'stairs';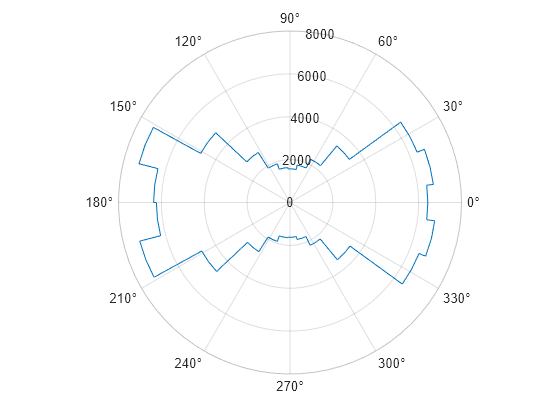
输入参数
名称-值参数
将可选参量对组指定为 Name1=Value1,...,NameN=ValueN,其中 Name 是参量名称,Value 是对应的值。名称-值参量必须出现在其他参量之后,但对各个参量对组的顺序没有要求。
示例: polarhistogram(theta,FaceAlpha=0.3) 创建一个具有半透明条形的直方图。
此处所列的直方图属性只是子集。有关完整列表,请参阅 Histogram 属性。
bin 范围,指定为 [bmin,bmax] 形式的二元素向量,其中 bmin 小于 bmax。
此选项使用介于 bmin 和 bmax(含)之间的输入数组值绘制直方图。即 theta(theta>=bmin & theta<=bmax)。
示例: polarhistogram(theta,'BinLimits',[-pi/2 pi/2]) 仅使用 theta 中介于 -pi/2 和 pi/2(含二者)之间的值绘制直方图。
bin 顶部的宽度,指定为小于 2π 的标量。
polarhistogram 使用的 bin 数量最多为 65,536 个(即 216)。如果指定的 bin 宽度需要更多 bin,polarhistogram 将使用最大数目的 bin 并相应地调整 bin 宽度。
示例: polarhistogram(theta,'BinWidth',pi) 使用宽度为 π 的 bin。
归一化类型,指定为此表中的一个值。
| 值 | 描述 |
|---|---|
'count' | 默认的归一化方案。每个条形的高度是每个 bin 中累积的观测值数量。条形高度的总和是 |
'probability' | 每个条形的高度是相对的观测值数量。每个高度的计算方法为:(bin 内的观测值数量/观测值总数量)。条形高度的总和是 |
'countdensity' | 每个条形的高度等于 bin 内的观测值数量/bin 宽度。 |
'pdf' | 概率密度函数的估计值。每个条形的高度等于(bin 内的观测值数量)/(观测值总数量 * bin 宽度)。每个条形的面积是相对的观测值数量。条形面积的总和是 |
'cumcount' | 每个条形的高度是每个 bin 及以前的所有 bin 中累积的观测值数量。最后一个条形的高度是 |
'cdf' | 累积分布函数估算值。每个条形的高度等于该 bin 及以前的所有 bin 中累积的相对观测值数量。最后一个条形的高度是 |
示例: polarhistogram(theta,'Normalization','pdf') 绘制 theta 的概率密度函数估算值。
直方图显示样式,指定为下列值之一:
'stairs'- 仅显示直方图轮廓。'bar'- 显示每个条形和填充的内部区域。
示例: polarhistogram(theta,'DisplayStyle','stairs') 绘制直方图的轮廓。
直方图条形的透明度,指定为介于 0 和 1(包括二者)之间的标量值。polarhistogram 对所有的直方图条形使用相同的透明度。值 1 表示完全不透明,0 则表示完全透明(不可见)。
示例: polarhistogram(theta,'FaceAlpha',.5) 创建一个具有半透明条形的直方图。
直方图的条形颜色,指定为 'auto'、RGB 三元组、十六进制颜色代码、颜色名称或短名称。默认值 'auto' 将由直方图选择颜色。
对于自定义颜色,请指定 RGB 三元组或十六进制颜色代码。
RGB 三元组是包含三个元素的行向量,其元素分别指定颜色中红、绿、蓝分量的强度。强度值必须位于
[0,1]范围内,例如[0.4 0.6 0.7]。十六进制颜色代码是字符串标量或字符向量,以井号 (
#) 开头,后跟三个或六个十六进制数字,范围可以是0到F。这些值不区分大小写。因此,颜色代码"#FF8800"与"#ff8800"、"#F80"与"#f80"是等效的。
此外,还可以按名称指定一些常见的颜色。下表列出了一些命名颜色选项、其等效 RGB 三元组及十六进制颜色代码。
| 颜色名称 | 短名称 | RGB 三元组 | 十六进制颜色代码 | 外观 |
|---|---|---|---|---|
"red" | "r" | [1 0 0] | "#FF0000" |
|
"green" | "g" | [0 1 0] | "#00FF00" |
|
"blue" | "b" | [0 0 1] | "#0000FF" |
|
"cyan" | "c" | [0 1 1] | "#00FFFF" |
|
"magenta" | "m" | [1 0 1] | "#FF00FF" |
|
"yellow" | "y" | [1 1 0] | "#FFFF00" |
|
"black" | "k" | [0 0 0] | "#000000" |
|
"white" | "w" | [1 1 1] | "#FFFFFF" |
|
"none" | 不适用 | 不适用 | 不适用 | 无颜色 |


下表列出了浅色和深色主题中绘图的默认调色板。
| 调色板 | 调色板颜色 |
|---|---|
在 R2025a 之前的版本中: 大多数绘图默认使用这些颜色。 |
|
|
|


您可以使用 orderedcolors 和 rgb2hex 函数获取这些调色板的 RGB 三元组和十六进制颜色代码。例如,获取 "gem" 调色板的 RGB 三元组并将其转换为十六进制颜色代码。
RGB = orderedcolors("gem");
H = rgb2hex(RGB);
在 R2023b 之前的版本中: 使用 RGB = get(groot,"FactoryAxesColorOrder") 获取 RGB 三元组。
在 R2024a 之前的版本中: 使用 H = compose("#%02X%02X%02X",round(RGB*255)) 获取十六进制颜色代码。
如果将 DisplayStyle 指定为 'stairs',则 polarhistogram 不使用 FaceColor 属性。
示例: polarhistogram(theta,'FaceColor','g') 创建一个带绿色条形的直方图。
限制
polarhistogram不支持在极坐标区中创建分类数据直方图。