subtitle
为绘图添加副标题
说明
示例
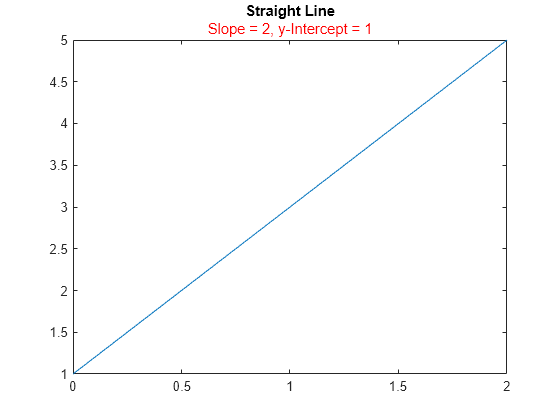
创建一个绘图。使用 title 函数添加标题。然后使用 subtitle 函数添加副标题。
plot([0 2],[1 5])
title('Straight Line')
subtitle('Slope = 2, y-Intercept = 1')

创建一个绘图,并向绘图添加标题。将 slopevalue 和 yintercept 定义为数值变量。将 txt 定义为字面文本的组合,并将 slopevalue 和 yintercept 的值转换为字符向量。然后,将 txt 传递给 subtitle 函数以显示副标题。
plot([0 2],[1 5])
title('Straight Line')
slopevalue = 4;
yintercept = 1;
txt = ['Slope = ' int2str(slopevalue) ', y-Intercept = ' int2str(yintercept)];
subtitle(txt)

创建一个绘图。使用 title 函数添加标题。然后,调用 subtitle 函数,并使用 'Color' 名称-值对组参量指定颜色。颜色可以是颜色名称,如 'red',您也可以使用 RGB 三元组或十六进制颜色代码指定自定义颜色。在本例中,指定 'red'。
plot([0 2],[1 5])
title('Straight Line')
subtitle('Slope = 2, y-Intercept = 1','Color','red')
或者,调用带输出参量的 subtitle 函数以返回文本对象。然后对文本对象设置颜色。在本例中,指定十六进制颜色代码 '#DD5500'。
txt = subtitle('Plot of y = 2x + 1');
txt.Color = '#DD5500';

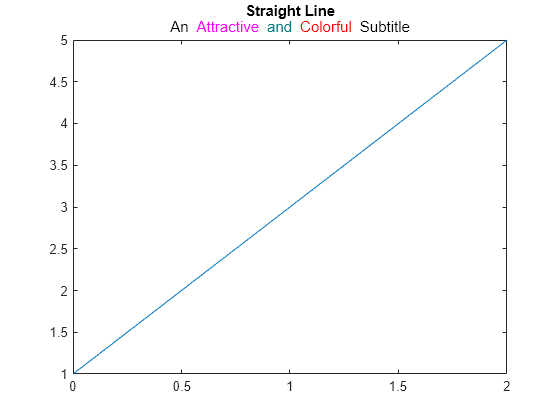
创建一个绘图,并使用 title 函数添加标题。创建一个包含 TeX 标记的字符向量,为副标题中的不同单词使用自定义颜色。然后将该字符向量传递给 subtitle 函数。
plot([0 2],[1 5])
title('Straight Line')
txt = ['An {\color{magenta}Attractive '...
'\color[rgb]{0 .5 .5}and \color{red}Colorful} Subtitle'];
subtitle(txt)
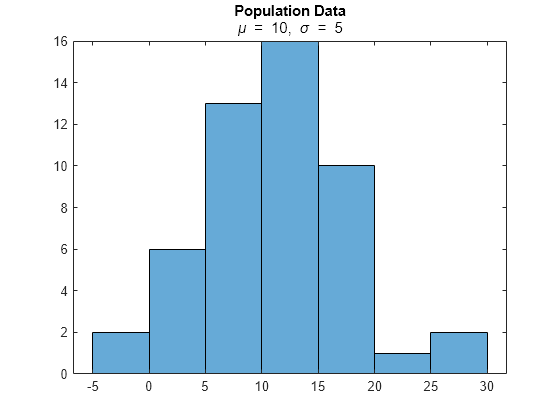
创建一个直方图,并使用 title 函数添加标题。创建一个包含使用希腊符号的 TeX 标记的字符向量。然后将该字符向量传递给 subtitle 函数。
histogram(5*randn(1,50)+10)
title('Population Data')
txt = '{\it\mu} = 10, {\it\sigma} = 5';
subtitle(txt)
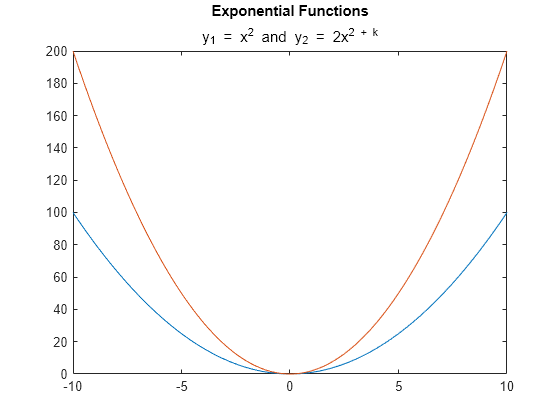
创建一个直方图,并使用 title 函数添加标题。创建一个包含显示下标和上标的 TeX 标记的字符向量。然后将该字符向量传递给 subtitle 函数。
x = -10:0.1:10;
y1 = x.^2;
y2 = 2*x.^2;
plot(x,y1,x,y2);
title('Exponential Functions')
txt = 'y_1 = x^2 and y_2 = 2x^{2 + k}';
subtitle(txt)
要为变量显示倾斜字体,请添加 \it 修饰符。
txt = '{\ity}_1 = {\itx}^2 and {\ity}_2 = 2{\itx}^{2 + \itk}';
subtitle(txt)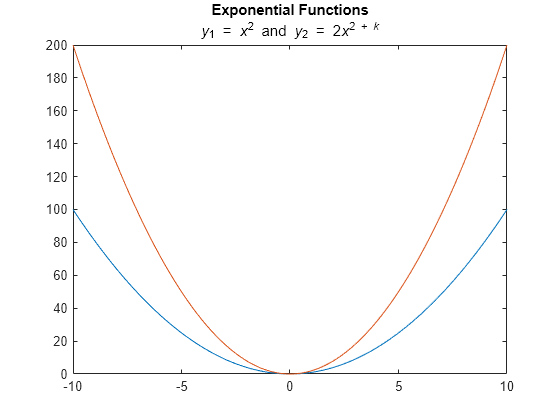
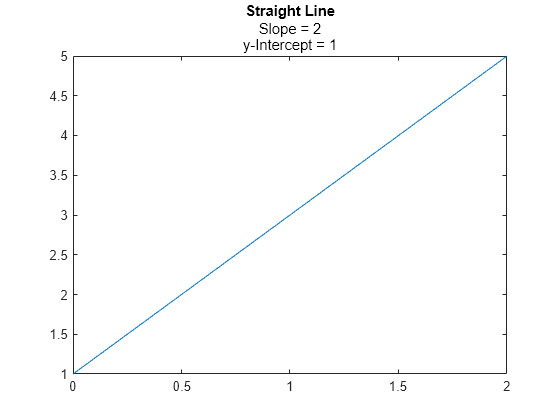
创建一个绘图,并使用 title 函数添加标题。然后通过将字符向量元胞数组传递给 subtitle 函数来创建包含两行文本的副标题。数组中的每个元素是一行文本。
plot([0 2],[1 5])
title('Straight Line')
txt = {'Slope = 2','y-Intercept = 1'};
subtitle(txt)
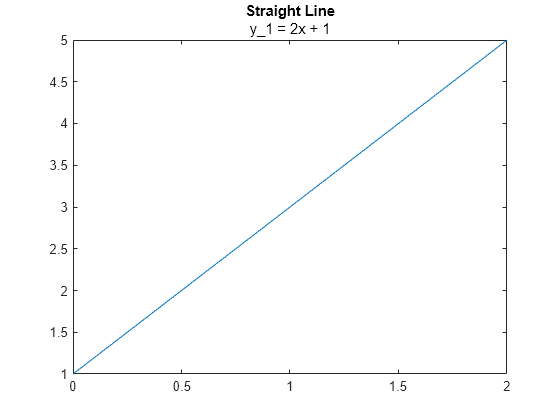
创建一个带有标题的绘图。然后创建一个包含下划线字符的副标题,TeX 解释器通常使用下划线字符表示下标。在调用 subtitle 函数时将 Interpreter 设置为 'none',以便下划线字符出现在副标题中。
plot([0 2],[1 5])
title('Straight Line')
subtitle('y_1 = 2x + 1','Interpreter','none')
创建一个绘图,并添加标题和副标题。获取当前坐标区,并通过将坐标区上的 TitleHorizontalAlignment 属性设置为 'left',将标题和副标题与图框的左边缘对齐。
plot([0 2],[1 5])
title('Straight Line')
subtitle('Slope = 2, y-Intercept = 1')
ax = gca;
ax.TitleHorizontalAlignment = 'left';

通过将坐标区上的 TitleHorizontalAlignment 属性设置为 'center',使标题和副标题居中。
ax.TitleHorizontalAlignment = 'center';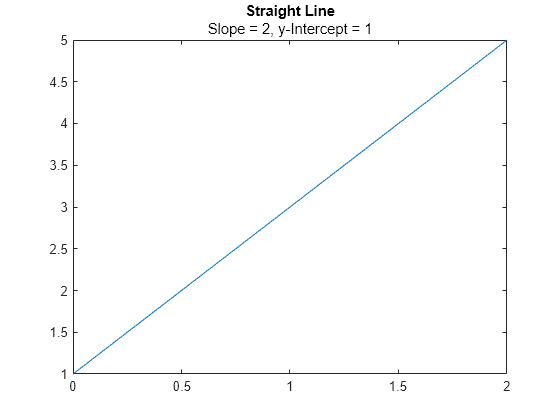
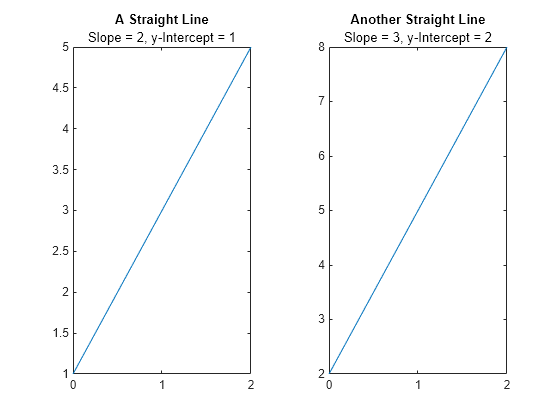
在一个分块图布局中创建两个绘图。然后向每个绘图加标题和副标题。
t = tiledlayout(1,2);

% Left plot
ax1 = nexttile;
plot([0 2],[1 5])
title(ax1,'A Straight Line')
subtitle(ax1,'Slope = 2, y-Intercept = 1')

% Right plot
ax2 = nexttile;
plot([0 2],[2 8])
title(ax2,'Another Straight Line')
subtitle(ax2,'Slope = 3, y-Intercept = 2')
输入参数
名称-值参数
提示
默认情况下,
Interactions属性包含editInteraction,因此可以通过点击文本来编辑文本。要禁用此交互,请将文本对象的Interactions属性设置为[]。
版本历史记录
在 R2020b 中推出