zscale
说明
示例
创建矩阵 X、Y 和 Z,并使用它们创建一个曲面图。
[X,Y] = meshgrid(0:1:100);
Z = X.*Y;
surf(X,Y,Z,EdgeColor="none")
view(-145,10)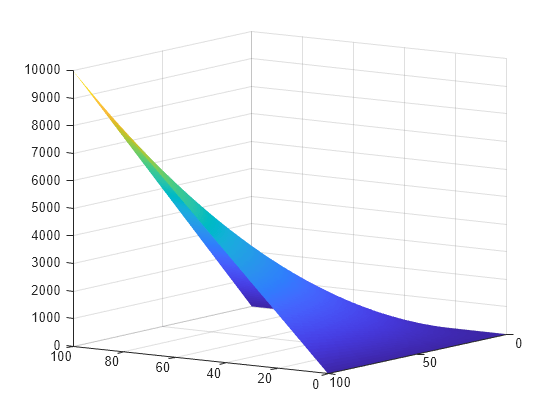
将 z 轴的刻度更改为对数。
zscale log
在一个分块图布局中两次创建相同的曲面图。以下代码调用 nexttile 函数来创建具有一个坐标区对象的分块图布局。对 nexttile 的第二次调用会创建并返回第二个坐标区对象。
[X,Y] = meshgrid(0:1:100);
Z = X.*Y;

nexttile;
surf(X,Y,Z,EdgeColor="none")
view(-145,10)
title("Linear Scale")

ax2 = nexttile;
surf(X,Y,Z,EdgeColor="none")
view(-145,10)
title("Log Scale")
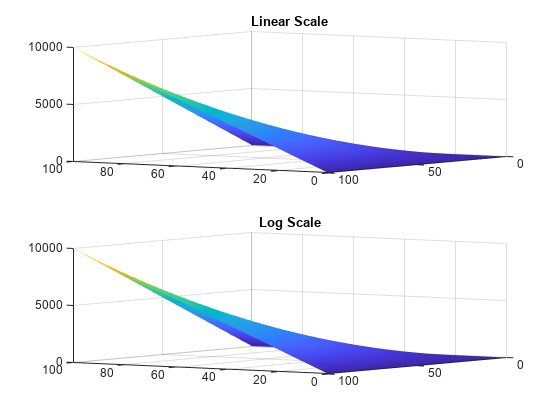
将底部绘图的 z 轴刻度更改为对数刻度。
zscale(ax2,"log")
输入参数
版本历史记录
在 R2023b 中推出