Analyze Output for All Runs
To analyze the output for all runs, switch to the Optimization Output view for the optimization.
Analyze all runs with green square Accept icons (
 ).
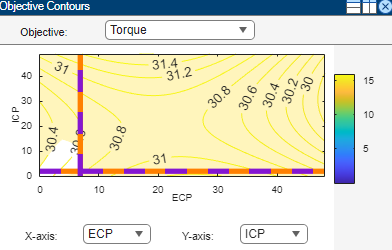
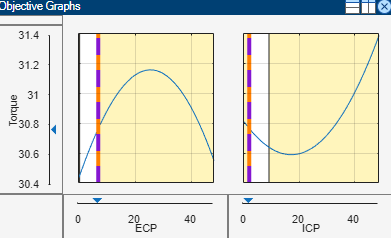
).For each run inspect the Objective Graph and the Objective Contour Plot. The objective graphs and the objective contour plots both display the lookup table value in purple and the solution value in orange at the current operating point selected. For more information, see View Your Optimization Results.
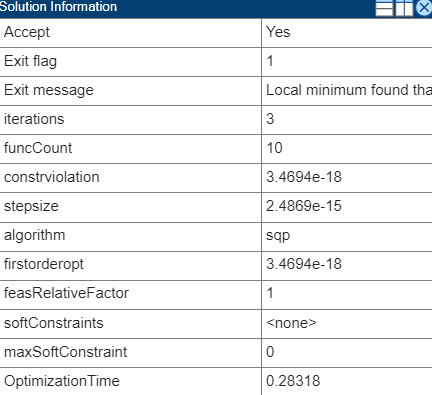
To gain further insights into the optimization process, you can display the Solution Information table on the RHS of the Optimization Output view. This table provides details in the Exit Message row, such as whether a local optimum has been found. Many optimization algorithms are designed to locate local optima, for example,
fminconin CAGE. Check each successful run to ensure that the optimizer has found the best solution possible. For more information, see Solution Information Table and Detecting Local Optima.Does the optimization appear to have terminated early? In some cases an optimization appears to return sub-optimal results even though the optimizer has returned a positive exit flag. Investigate such cases. See Investigate Early Termination of Optimization.
Repeat steps 2a and 2b to analyze all runs with orange triangle Accept icons (
 ) that indicate the optimization
terminated early. See Investigate Early Termination of Optimization.
) that indicate the optimization
terminated early. See Investigate Early Termination of Optimization.Repeat steps 2a and 2b to analyze all runs with red circle Accept icons (
 ) that indicate failures. These runs have
typically failed to meet constraints. Inspect the plots and determine if it
is acceptable to relax any of the constraints.
) that indicate failures. These runs have
typically failed to meet constraints. Inspect the plots and determine if it
is acceptable to relax any of the constraints.
See Also
View Your Optimization Results | All Optimization Results | Current Result - Optimization Solution