Import Strategy and Optimize Estimates
Import a strategy and optimize the estimates.
Step 4: Import Strategy
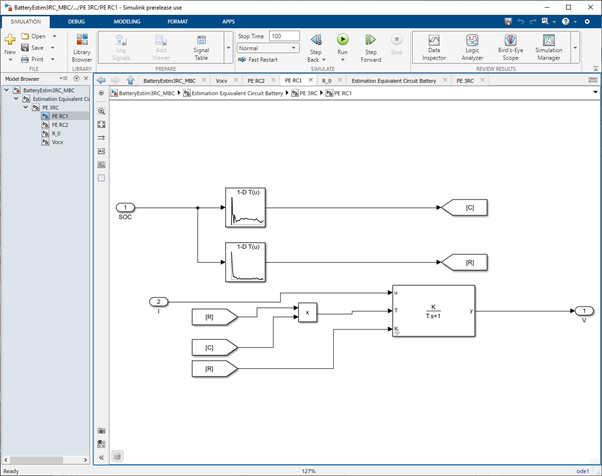
Import a Simulink® model with the battery discharge data.
Open Simulink Model
For this example, open the Simulink
BatteryEstim3RC_MBC model in
matlab/toolbox/mbc/mbctraining.
To enable efficient optimization, the model uses a Continuous First-order System block to implement an RC circuit.
Update Parameters
Update the model parameters with the estimates from step 4. Use this code. Save the Simulink model.
Import Strategy
In CAGE, select File > Import > Strategy.
Select the Simulink model.
In the MBC Feature Importer dialog box, click OK.
In the CAGE Parser dialog box, accept the discrete sample time. Click OK. The CAGE browser opens with the imported strategy.
Note
The sample rate should allow the Simulink model to run with an ode1 solver. Typically, this sample time is about 0.1s to 1s. For this example, specify a sample time
1.Save your CAGE project.
Step 5: Optimize Estimates
Optimize the Em, R0, Rx, and Tau estimates using CAGE. Open the CAGE project from step 4.
To open a project with steps 1-4 complete, in the CAGE Case Studies pane:
Select
Equivalent circuit battery characterization.Click Open Example.
After you open the CAGE project file:
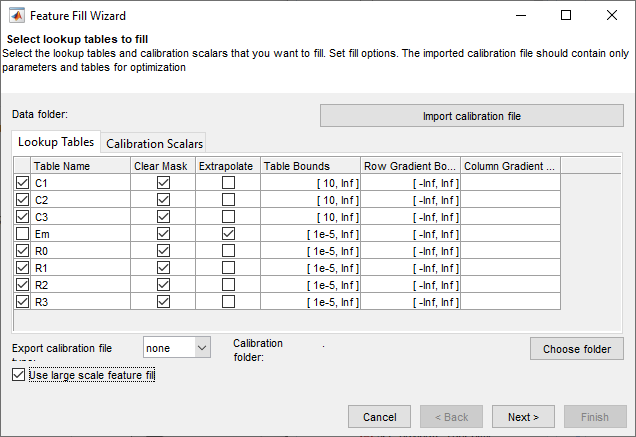
Select Fill Feature.
In the Feature Fill Wizard:
Select all R and C tables.
Do not fill open circuit voltage table, Em.
Set the bounds for R and C to a small positive number.
Select Use large scale feature fill.
Click Next.
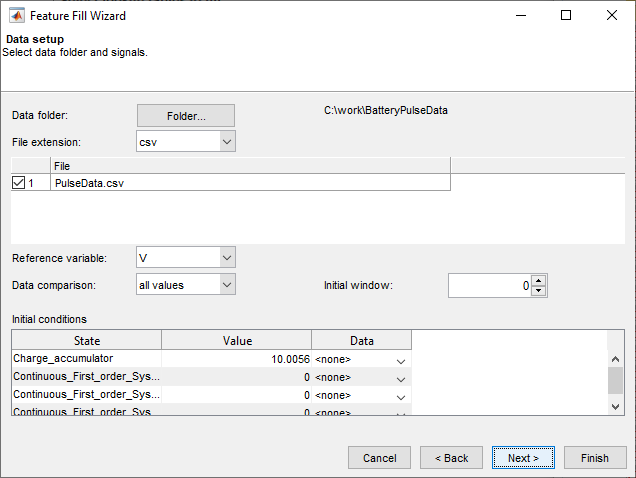
In the Feature Fill Wizard:
Use Choose folder to select the pulse data files. For this example, select
matlab/toolbox/mbc/mbctraining/BatteryPulseData.Pulse data file requirements:
CSV file format
Multiple data files allowed
Put all the data files in one folder
Signal names must match the Simulink inport block names
Sample rate for data should be constant and allow the Simulink model to run with an ode1 solver. Typically, this sample time is about 0.1s to 1s.
Set Reference variable to the measured voltage,
V.Accept the default Initial conditions.
Click Next.
In the Feature Fill Wizard:
Set Algorithm to
Nonlinear
                                        least squares
.
Click Finish.
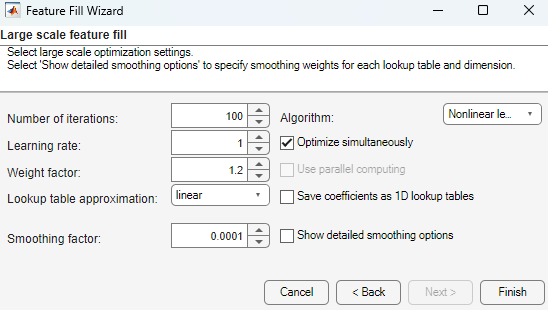
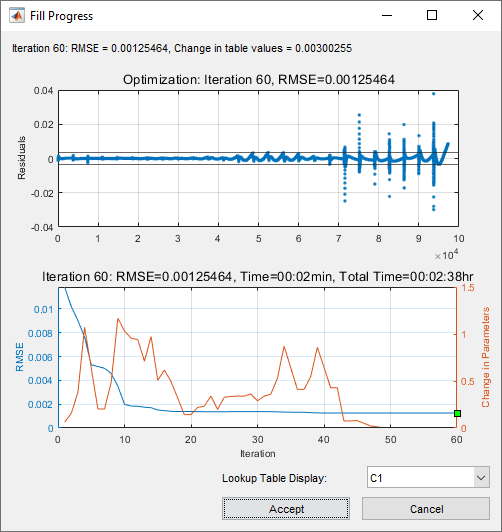
View the feature fill progress. As the change in parameters and RMSE approaches 0, click Accept.
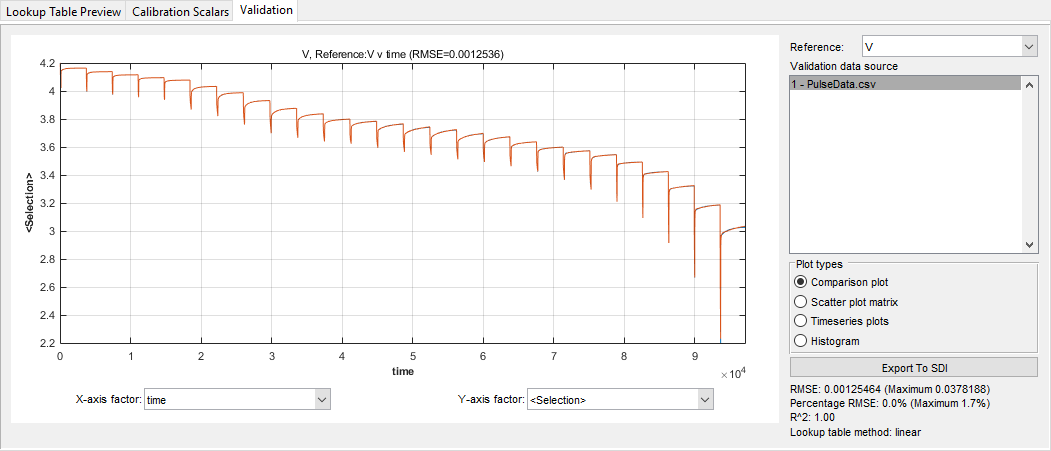
In the CAGE browser, in the Validation tab, examine the validation data. You can visualize the data by using several validation plots. Select the plot type in the Plot types section. You can select:
Comparison plot
Scatter plot matrix
Timeseries plots
Histogram
Comparison plot displays by default.
Further Study
To include temperature effects, replace the 1D R and C lookup tables with 2D lookup tables in the PE RC1, PE RC2, and PE RC3 model subsystems. Consider whether to use ambient temperature, surface temperature, or internal battery temperature as the temperature signal when estimating these lookup tables. You will likely need separate CSV files for different temperatures and charge levels.