Prepare Motor Data for Modeling
To model the motor data, use the MBC Model Fitting app to import,
filter, and fit the data with a point-by-point model. For this example, the data file
PMSM_MBCData.xlsx contains a large dataset. You can use a design of
experiment (DOE) to limit the data. However, the data set represents typical FEA analysis
results.
Since a simple relationship exists between the d- and q-axis currents for fixed torque-speed operating points, the point-by-point model provides an accurate fit.
For comparison, the PMSM maximum efficiency calibration case study contains the model fit.

Import Data
For this example, PMSM_MBCData.xlsx contains this motor controller data:
Total flux, Ψtotal, in Wb
Allowed flux, Ψmax, in Wb
d-axis current, Id, in A
q-axis current, Iq, in A
Current magnitude, Is, in A
Voltage magnitude, Vs, in V
Motor torque, Te, in N·m
Motor speed, n, in rpm
In MATLAB®, on the Apps tab, in the Automotive group, click MBC Model Fitting.
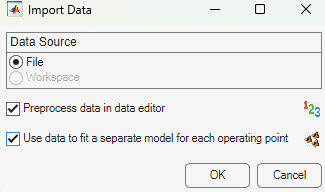
In the Model Browser home page, click Import Data.
Select Use data to fit a separate model for each operating point, then click OK to open a data source file.
Navigate to the
matlab\toolbox\mbc\mbctrainingfolder. Open the data filePMSM_MBCData.xlsx. The Define Operating Point Groups dialog box and the Data Editor open with your data.
Define Operating Point Groupings
For point-by-point models, you need to define operating point groups. For this example, define groups for motor speed. Set the tolerances so that Model-Based Calibration Toolbox™ groups small variations in speed at the same operating point.
Define an operating point group using speed, n.
Set the motor speed tolerance, n, to
90.000.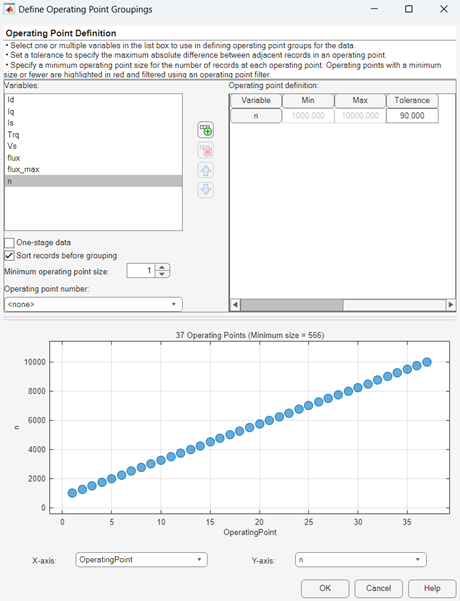
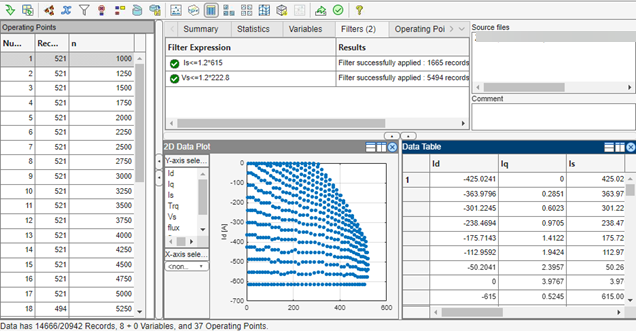
Filter Data
You can filter data to exclude records from the model fit. For this example, set up a filter to include only current and voltage magnitudes that are less than a specified threshold:
Current magnitude, Is, less than or equal to
1.2*615ACurrent voltage, Vs, less than or equal to
1.2*222.8V
The filters keep data 20% above the maximum current and voltage to ensure the models provide an accurate fit at these limits.
In the Data Editor, select Tools > Filters to open the Filter Editor. Create these filters:
Is <= 1.2*615Vs <= 1.2*222.8
Alternatively, you can navigate to the Filters tab, right-click in the window, and click Add to open the Filter Editor dialog box.
In the Data Editor, select File > Save & Close. Accept the changes to the data.