Assess High-Level Model Trends
After fitting models in the Model Browser, to assess high-level model trends, use the Response Models plots at the test plan node.
After you fit models, the view at the test plan node displays the Response Models tab. If you are two-stage modeling you must create a two-stage model to see the Response Models plots.
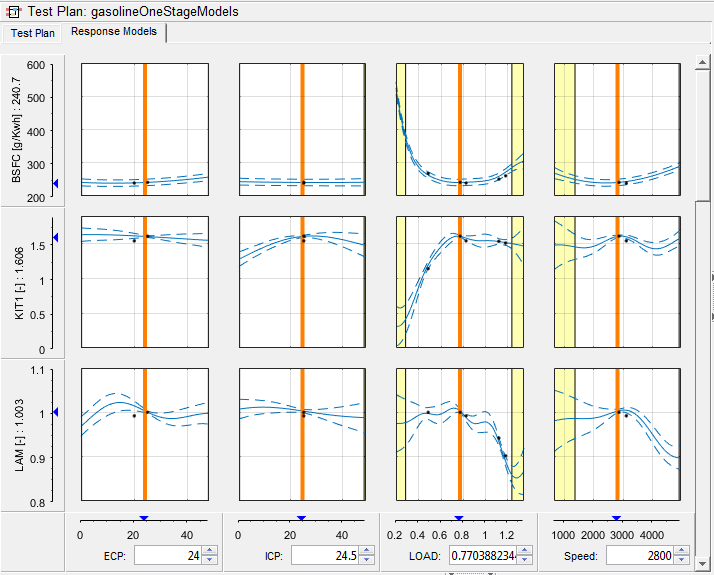
View the cross-section plots of all your response models. You can use the following options:
To select a value of an input, either drag the orange line in a plot, change the value in the edit box under the graph, or change the value in the Value box on the right.
To change the range for displaying data points within tolerance of the input values, edit the Tolerance boxes on the right.
To set the axes limits to the boundary constraint boundary, select the Zoom to boundary constraint check box. This zooms the plots inside the constraint boundaries, so you can explore models in valid regions only.
The plots display confidence levels, common Y limits, boundary constraints, and data points within the Tolerance values. Edit these settings using the controls on the right.
When you are displaying a point-by-point model, select the operating point to display using the Operating Point controls. For point-by-point models, the plots show only the cross-sections of the local inputs.