Analyze and Verify Motor Control Algorithms Using Polyspace
This example uses the Polyspace® static code analysis tools to analyze and verify Simulink® models containing motor control algorithms. Static code analysis is a software verification technique that analyzes source code for quality, reliability, and security without executing the code. This approach uses robust error detection routines (that include checks for critical run-time errors) to identify bugs and defects and in addition ensures compliance with common coding standards. It provides a cost-effective alternative to measure and track the software quality metrics and eliminates the need to instrument the code or to write elaborate unit test cases.
Polyspace uses formal methods to prove the absence of critical run-time errors under all possible control flows and data flows. The methods include checks for coding rules, security vulnerabilities, code metrics, and many other additional classes of bugs.
Polyspace Bug Finder™ uses static analysis, including semantic analysis, to analyze software control flow, data flow, and interprocedural behavior to identify run-time errors, concurrency issues, security vulnerabilities, and other defects in C and C++ embedded software. Bug Finder also checks for compliance with coding rule standards such as MISRA C®, MISRA C++, AUTOSAR C++14, CERT® C, CERT C++, and custom naming conventions. Bug Finder generates reports that provide information on bugs found, code-rule violations, and code quality metrics, including cyclomatic complexity. For automatically generated code, Polyspace results can be traced back to Simulink models.
Polyspace Code Prover™ proves the absence of overflow, divide-by-zero, out-of-bounds array access, and certain other run-time errors in C and C++ source code without requiring program execution, code implementation, or test cases. Code Prover color-codes each operation to indicate whether the operation is free of run-time errors, proven to fail, unreachable, or unproven. Code Prover also displays range information for variables and function return values and proves which variables exceed specified range limits.
This workflow shows you how to use Bug Finder and Code Prover to analyze any Motor Control Blockset™ model or a Simulink model containing a motor control algorithm.
Generate Code for Simulink Model
Before you can use Polyspace, you must generate code for the Simulink model that you want to analyze.
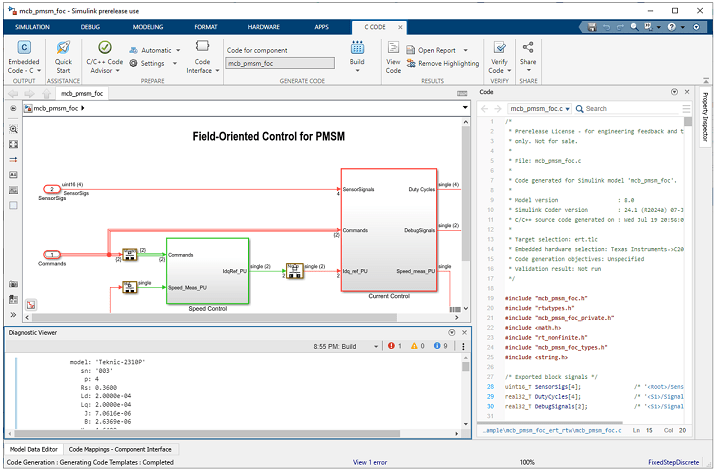
1. If you are using Motor Control Blockset, use the example doc page to open the Simulink model of your choice using the openExample command. You can use any Simulink model containing a motor control algorithm. In this example, you analyze the model mcb_pmsm_foc.slx from the Field-Oriented Control of PMSM Using Quadrature Encoder example. You can open the model by typing this command in the command window.
openExample('mcb/FOCQepExample','supportingFile','mcb_pmsm_foc.slx');
2. In the Simulink toolstrip, click Apps > Embedded Coder to open the C Code tab.

3. In the C Code tab, click Build to generate code and build the Simulink model.


Analyze Generated Code Using Polyspace Bug Finder
Complete the following steps to analyze the generated code for your model using Polyspace Bug Finder.
1. In the Simulink toolstrip, click Apps > Polyspace Code Verifier to open the Polyspace app.

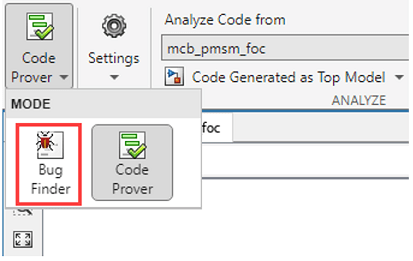
2. Use the Mode option to select Bug Finder.

3. Click Run Analysis to start running the Bug Finder tool.

4. After the tool execution completes, click Polyspace > Analysis Results to open the code analysis results in the Polyspace app.


To better understand the Polyspace Bug Finder results and investigate the bug, compliance error, or a calculated metric, see Polyspace Bug Finder Results (Polyspace Bug Finder).
For details about reviewing the results using either the Polyspace user interface, a web browser, or IDEs, see Reviewing and Reporting Results (Polyspace Code Prover) and Add Review Information to Results (Polyspace Code Prover).
Analyze Generated Code Using Polyspace Code Prover
Complete the following steps to analyze the generated code for your model using Polyspace Code Prover.
1. In the Simulink toolstrip, click Apps > Polyspace Code Verifier to open the Polyspace app.

2. Use the Mode option to select Bug Finder.

3. Click Run Analysis to start running the Code Prover tool.

4. After the tool execution completes, click Polyspace > Analysis Results to open the code analysis results in the Polyspace app.

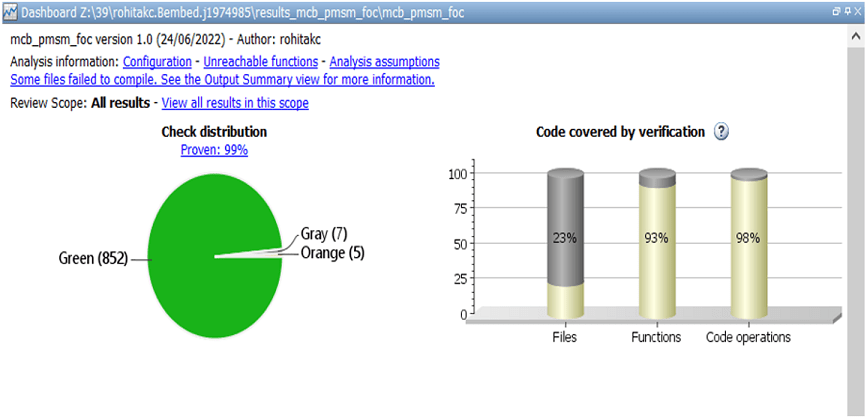
After execution, the results show color-codes assigned to all operations. To better understand the Polyspace Code Prover results and investigate the run-time errors, stack usage metrics, and global variable properties, see Polyspace Code Prover Results (Polyspace Code Prover).
For details about reviewing the results using either the Polyspace user interface or a web browser, see Reviewing and Reporting Results (Polyspace Code Prover) and Add Review Information to Results (Polyspace Code Prover).