calculateSNR
Signal-to-noise ratio based on in-band bins of windowed FFT and location of input
Since R2026a
Description
Examples
Define a second-order delta-sigma modulator and the system parameters for the simulation.
order = 2;              % The "Order" of the modulator
OSR = 64;               % Oversampling Ratio (fs / 2*BW)
nlev = 2;               % Number of quantizer levels (2 = Binary: +1 or -1)
N = 2^14;               % Number of points for the FFT simulation (16,384)
test_freq = 5;          % The bin index for our test sine wave (must be an integer)
Determine the in-band frequency range for SNR calculation.
fB = floor(N/(2*OSR));
Synthesize the noise transfer function (NTF). This creates a mathematical filter that pushes noise to high frequencies.
ntf = synthesizeNTF(order, OSR);
Realize the NTF as a CIFB circuit topology.
[a, g, b, c] = realizeNTF(ntf, 'CIFB');Create the state-space matrix for the simulator.
abcd = stuffABCD(a, g, b, c, 'CIFB');Scale the ABCD matrix so that the internal voltages stay within the range of the quantizer.
[abcd_scaled, umax] = scaleABCD(abcd, nlev);
To set up the simulation, define a range of input amplitudes to test, from very quiet to loud. Run simulation.
amp_db = -110:10:-10;        % Decibels relative to Full Scale (dBFS)
amp_lin = 10.^(amp_db/20);   % Convert dB to linear voltage
snr_sim = zeros(size(amp_db)); % Pre-allocate space for results
for i = 1:length(amp_db)
    % Generate a test sine wave at the current amplitude
    t = 0:N-1;
    u = amp_lin(i) * sin(2*pi*test_freq/N * t);

    % Run the Delta-Sigma Modulator Simulation
    % Returns 'v', which is the high-speed 1-bit output bitstream.
    v = simulateDSM(u, abcd_scaled, nlev);

    % Spectral Analysis:
    % 1. Apply a Hann window to prevent spectral leakage
    w = ds_hann(N);
    % 2. Perform the FFT
    V = fft(v .* w);
    % 3. Calculate SNR of the in-band portion
    % calculateSNR sums signal power at 'test_freq' and noise in remaining bins.
    snr_sim(i) = calculateSNR(V(1:fB), test_freq);
end
Predict the theoretical SNR. Calculate a peak value to anchor the predicted SNR curve.
peak_snr_theory = 10*log10( ((2*order+1)/(2*pi^(2*order))) * (OSR^(2*order+1)) );
snr_pred = peak_snr_theory + amp_db;
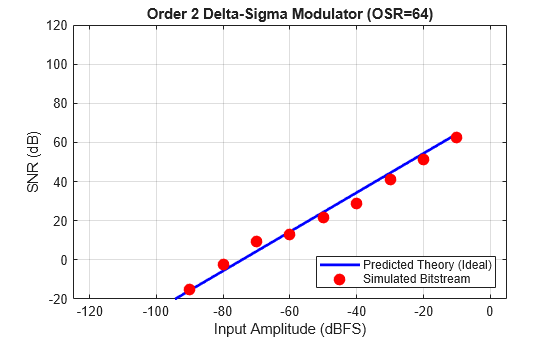
Plot the predicted and simulated SNR.
figure('Color', 'w', 'Name', 'Delta-Sigma Performance');

% Plot the Theoretical Limit (The Blue Line)
plot(amp_db, snr_pred, 'b-', 'LineWidth', 2); hold on;

% Plot the Actual Simulated Results (The Red Dots)
plot(amp_db, snr_sim, 'ro', 'MarkerFaceColor', 'r', 'MarkerSize', 8);

% Formatting the plot
grid on;
axis([-125 5 -20 120]); % Set fixed view for comparison
xlabel('Input Amplitude (dBFS)');
ylabel('SNR (dB)');
title(sprintf('Order %d Delta-Sigma Modulator (OSR=%d)', order, OSR));
legend('Predicted Theory (Ideal)', 'Simulated Bitstream', 'Location', 'SouthEast');
Input Arguments
Output Arguments
Version History
Introduced in R2026a
See Also
calculateTF | synthesizeNTF | realizeNTF | stuffABCD | mapABCD | scaleABCD | predictSNR | simulateSNR | simulateDSM