Profiling Parallel Code
The parallel profiler provides an extension of the profile
command and the profile viewer specifically for workers in a
parallel pool, to enable you to see how much time each worker spends evaluating each
function and how much time communicating or waiting for communications with the other
workers. For more information about the standard profiler and its views, see Profile Your Code to Improve Performance.
For parallel profiling, you use the mpiprofile
command in a similar way to how you use
profile
.
Profile Parallel Code
This example shows how to profile parallel code using the parallel profiler on workers in a parallel pool.
Create a parallel pool.
numberOfWorkers = 3; pool = parpool(numberOfWorkers);
Starting parallel pool (parpool) using the 'local' profile ... Connected to the parallel pool (number of workers: 3).
Collect parallel profile data by enabling mpiprofile
.
mpiprofile on
Run your parallel code. For the purposes of this example, use a simple parfor
loop that iterates over a series of values.
values = [5 12 13 1 12 5]; tic; parfor idx = 1:numel(values) u = rand(values(idx)*3e4,1); out(idx) = max(conv(u,u)); end toc
Elapsed time is 51.886814 seconds.
After the code completes, view the results from the parallel profiler by calling mpiprofile viewer
. This action also stops profile data collection.
mpiprofile viewer
The report shows execution time information for each function that runs on the workers. You can explore which functions take the most time in each worker.
Generally, comparing the workers with the minimum and maximum total execution times is useful. To do so, click Max vs Min Total Time in the report. In this example, observe that conv
executes multiple times and takes significantly longer in one worker than in the other. This observation suggests that the load might not be distributed evenly across the workers.
If you do not know the workload of each iteration, then a good practice is to randomize the iterations, such as in the following sample code.
values = values(randperm(numel(values)));
If you do know the workload of each iteration in your
parfor
loop, then you can useparforOptions
to control the partitioning of iterations into subranges for the workers. For more information, seeparforOptions
.
In this example, the greater values(idx)
is, the more computationally intensive the iteration is. Each consecutive pair of values in values
balances low and high computational intensity. To distribute the workload better, create a set of parfor
options to divide the parfor
iterations into subranges of size 2
.
opts = parforOptions(pool,"RangePartitionMethod","fixed","SubrangeSize",2);
Enable the parallel profiler.
mpiprofile on
Run the same code as before. To use the parfor
options, pass them to the second input argument of parfor
.
values = [5 12 13 1 12 5]; tic; parfor (idx = 1:numel(values),opts) u = rand(values(idx)*3e4,1); out(idx) = max(conv(u,u)); end toc
Elapsed time is 33.813523 seconds.
Visualize the parallel profiler results.
mpiprofile viewer
In the report, select Max vs Min Total Time to compare the workers with the minimum and maximum total execution times. Observe that this time, the multiple executions of conv
take a similar amount of time in all workers. The workload is now better distributed.
Analyze Parallel Profile Data
The profiler collects information about the execution of code on each worker and the communications between the workers. Such information includes:
Execution time of each function on each worker.
Execution time of each line of code in each function.
Amount of data transferred between each worker.
Amount of time each worker spends waiting for communications.
The remainder of this section is an example that illustrates some of the features of the parallel profile viewer. The example profiles parallel execution of matrix multiplication of distributed arrays on a parallel pool of cluster workers.
parpool
Starting parallel pool (parpool) using the 'MyCluster' profile ... Connected to the parallel pool (number of workers: 64).
R1 = rand(5e4,'distributed'); R2 = rand(5e4,'distributed'); mpiprofile on R = R1*R2; mpiprofile viewer
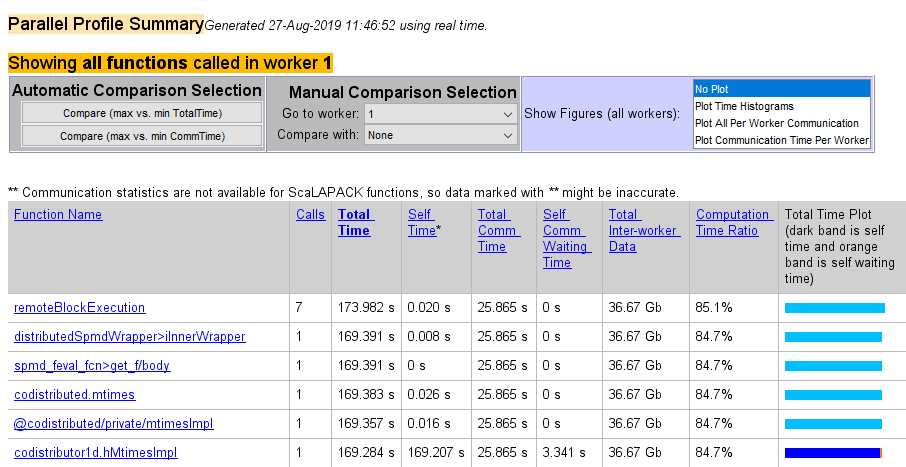
The last command opens the Profiler window, first showing the Parallel Profile Summary (or function summary report) for worker 1.
The function summary report displays the data for each function executed on a worker in sortable columns with the following headers:
Column Header | Description |
---|---|
Calls | How many times the function was called on this worker |
Total Time | The total amount of time this worker spent executing this function |
Self Time | The time this worker spent inside this function, not within children or local functions |
Total Comm Time | The total time this worker spent transferring data with other workers, including waiting time to receive data |
Self Comm Waiting Time | The time this worker spent during this function waiting to receive data from other workers |
Total Inter-worker Data | The amount of data transferred to and from this worker for this function |
Computation Time Ratio | The ratio of time spent in computation for this function vs. total time (which includes communication time) for this function |
Total Time Plot | Bar graph showing relative size of Self Time, Self Comm Waiting Time, and Total Time for this function on this worker |
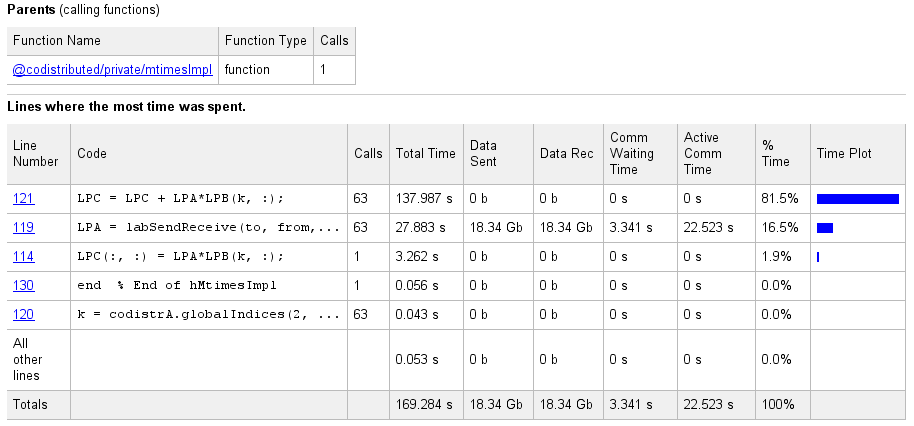
Select the name of any function in the list for more details about the execution
of that function. The function detail report for
codistributor1d.hMtimesImpl
includes this listing:
The code that the report displays comes from the client. If the code has changed on the client since the communicating job ran on the workers, or if the workers are running a different version of the functions, the display might not accurately reflect what actually executed.
You can display information for each worker, or use the comparison controls to display information for several workers simultaneously. Two buttons provide Automatic Comparison Selection, so you can compare the data from the workers that took the most versus the least amount of time to execute the code, or data from the workers that spent the most versus the least amount of time in performing interworker communication. Manual Comparison Selection allows you to compare data from specific workers or workers that meet certain criteria.
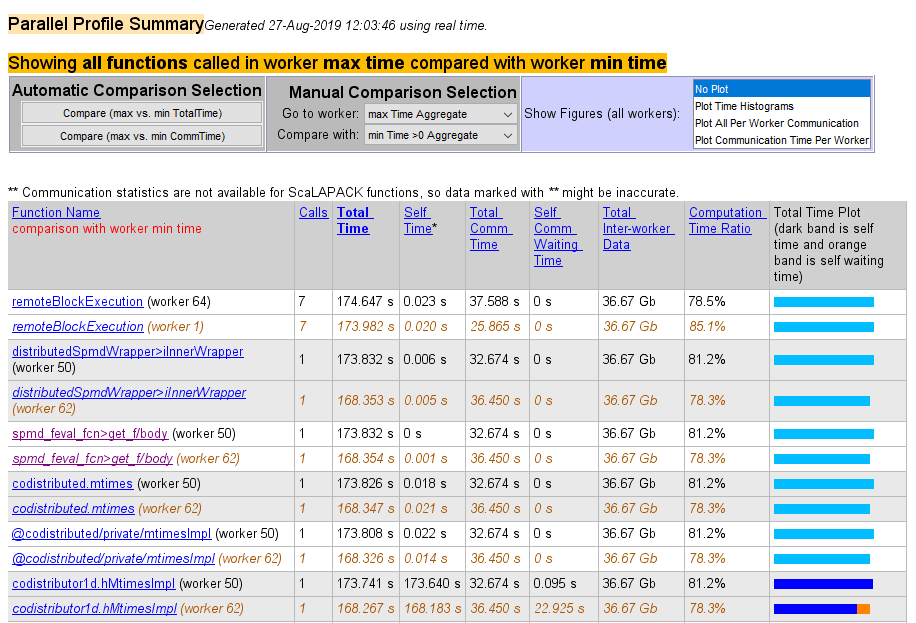
The following listing from the summary report shows the result of using the Automatic Comparison Selection of Compare (max vs. min TotalTime). The comparison shows data from worker 50 compared to worker 62 because these are the workers that spend the most versus least amount of time executing the code.
The following figure shows a summary of all the functions executed during the profile collection time. The Manual Comparison Selection of max Time Aggregate means that data is considered from all the workers for all functions to determine which worker spent the maximum time on each function. Next to each function's name is the worker that took the longest time to execute that function. The other columns list the data from that worker.
The next figure shows a summary report for the workers that spend the most versus
least time for each function. A Manual Comparison Selection of
max Time Aggregate against min Time >0
Aggregate generated this summary. Both aggregate settings indicate
that the profiler should consider data from all workers for all functions, for both
maximum and minimum. This report lists the data for
codistributor1d.hMtimesImpl
from workers 50 and 62, because
they spent the maximum and minimum times on this function. Similarly, other
functions are listed.
Select a function name in the summary listing of a comparison to get a detailed
comparison. The detailed comparison for
codistributor1d.hMtimesImpl
looks like this, displaying
line-by-line data from both workers:
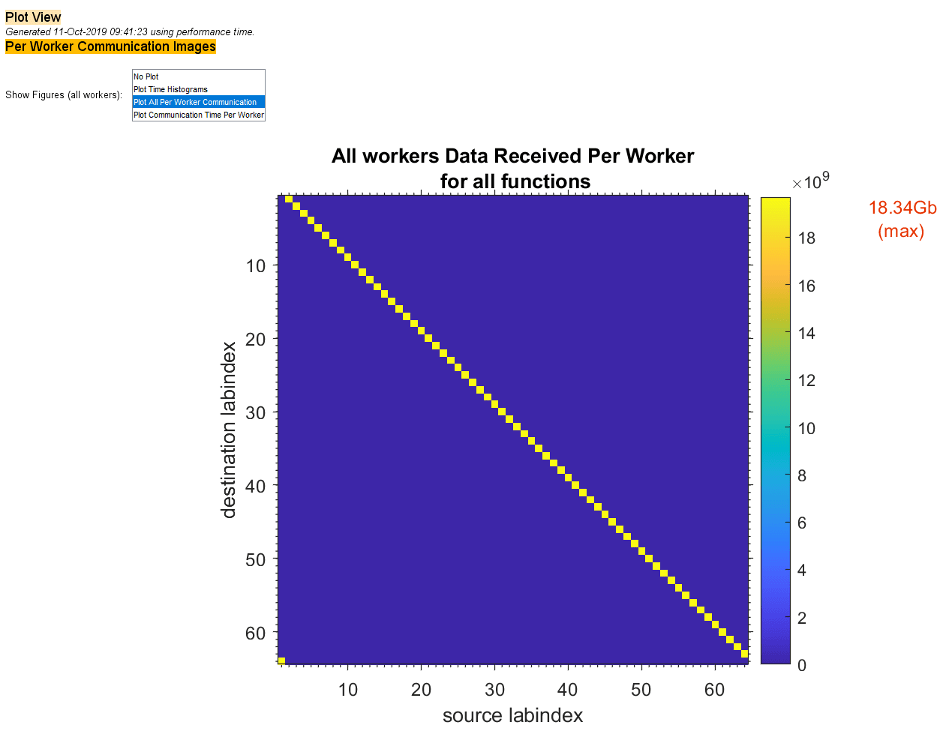
To see plots of communication data, select Plot All Per Worker Communication in the Show Figures menu. The top portion of the plot view report plots how much data each worker receives from each other worker for all functions.
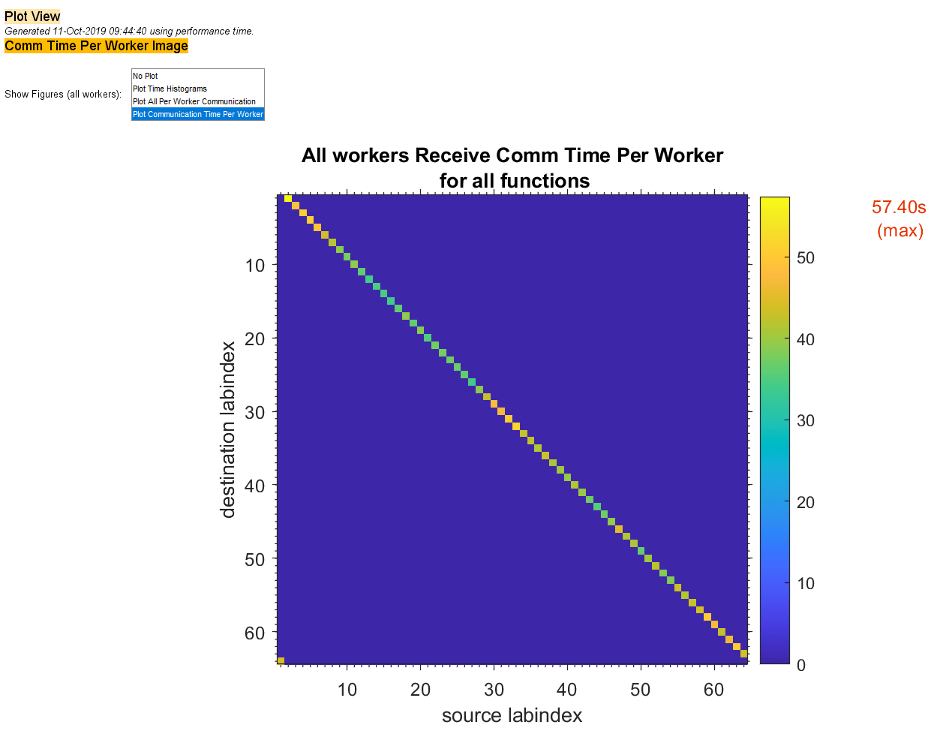
To see only a plot of interworker communication times, select Plot Communication Time Per Worker in the Show Figures menu.
Plots like those in the previous two figures can help you determine the best way to balance work among your workers, perhaps by altering the partition scheme of your codistributed arrays.