viewGain
Plot output transmitter power or output phase shift as a function of input transmitter power
Since R2024a
Syntax
Description
viewGain( plots the output power of the
first channel of the transmitter as a function of input power to the transmitter,
transm)tranms, due to the gain specified by the transmitter's
GainMethod property.
viewGain( plots the output
power on the transm,Parent=hax)hax axes.
viewGain( plots the
output power for the transm,ChannelInde=cidx)cidx channel.
Examples
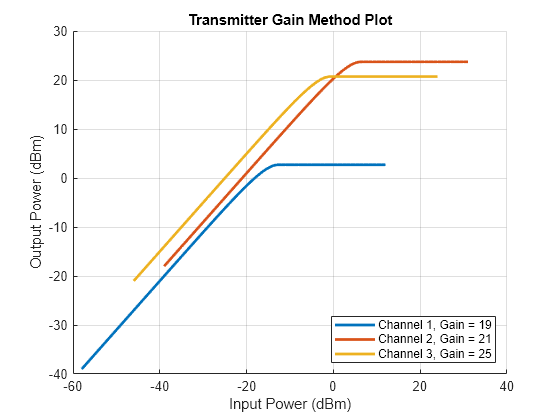
Transmit a pulse containing a linear FM waveform. The transmitter has three channels with different gains, OIP3 values, and phase offsets.
First, create an LFM waveform. The sample rate is 10 MHz, the pulse width is 10 microseconds, and the sweep bandwidth is 5 MHz.
fs = 10e6;
waveform = phased.LinearFMWaveform('SampleRate',fs, ...
    'PulseWidth',1e-5,'SweepBandwidth',5e6);
x = waveform();
Transmit the waveform over three channels..
tx = phased.Transmitter(Configuration="Budget",...
    GainMethod="Cubic polynomial",...
    Gain=[19,21,25],OIP3=[11,32,29],...
    PhaseOffset=[0,30,45]);
y = tx(x);
Display gains for each channel.
viewGain(tx,'ChannelIndex',1,'Parent',gca);
hold on
viewGain(tx,'ChannelIndex',2,'Parent',gca);
viewGain(tx,'ChannelIndex',3,'Parent',gca);
legend('Channel 1, Gain = 19','Channel 2, Gain = 21','Channel 3, Gain = 25', ...
    'Location','SouthEast')
hold off
Transmit a waveform through a phased.Transmitter System object™. Use a lookup table model to simulate non-linear gain behavior and specify noise using noise temperature. Display the transmitter phase shift.
fs = 1e7;
waveform = phased.LinearFMWaveform(SampleRate=fs,...
    PulseWidth=1e-5,SweepBandwidth=5e6);
wav = waveform();
Create a transmitter.
pw = [-10 -5 0 5 10 15 20 25 30 35 40]';
pw1 = ones(size(pw));
pw2 = [-3.8 -1.9 0 1.9 3.8 5.9 8.2 10 14 18 23]';
tbl = [pw,pw1,pw2];

transm = phased.Transmitter(Configuration="Budget",...
    GainMethod="Lookup table",Table=tbl, ...
    NoiseMethod="Noise temperature", ...
    NoiseTemperature=350, ...
    SampleRate=fs);
Pass the waveform through the transmitter.
y = transm(wav);
Display the phase shift for the channel.
viewGain(transm,Type="AmPm")