viewArray
View array geometry
Description
viewArray( displays the geometry of the
array)array.
viewArray(
displays the geometry of the array, with additional options specified by one or more
array,Name=Value)Name=Value pair arguments.
hndl = viewArray(___)
Examples
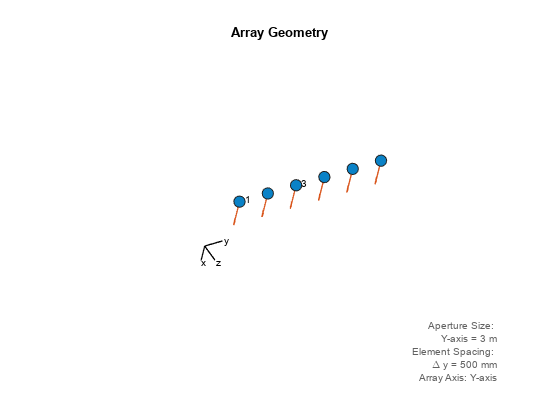
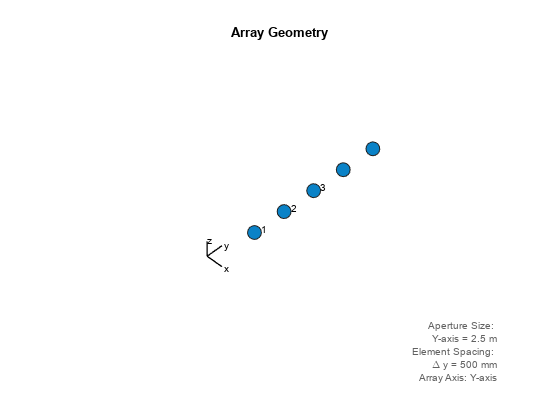
Draw a 6-element ULA and use the ShowIndex parameter to show the indices of the first and third elements.
array = phased.ULA(6);
viewArray(array,ShowIndex=[1 3],ShowNormals=true, ...
    ShowLocalCoordinates=true,Orientation=[60;100;45], ...
    ShowAnnotation=true)
This example shows how to display the element positions, normal directions, and indices for all elements of a 4-by-4 square URA.
ha = phased.URA(4);
viewArray(ha,ShowNormals=true,ShowIndex="All");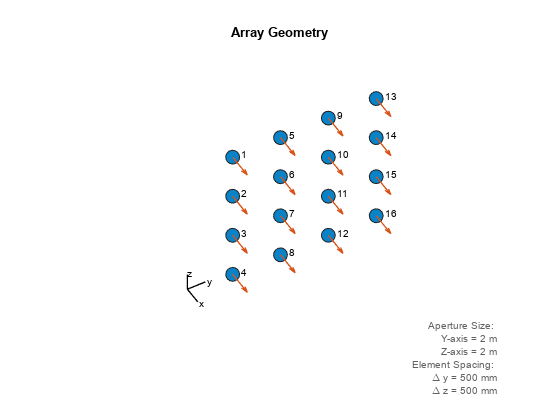
Display the element positions and normal directions of all elements of an 8-element uniform circular array.
Create the uniform circular array
N = 8;
azang = (0:N-1)*360/N - 180;
ha = phased.ConformalArray(...
    'ElementPosition',[cosd(azang);sind(azang);zeros(1,N)],...
    'ElementNormal',[azang;zeros(1,N)]);
Display the positions and normal directions of the elements
viewArray(ha,'ShowNormals',true);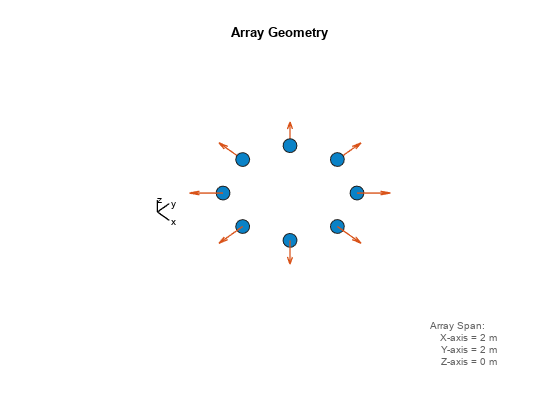
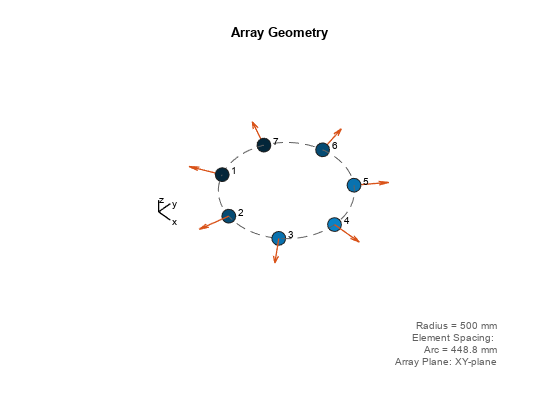
Construct an 7-element UCA of isotropic antenna elements with a Taylor window taper. Design the array to have a radius of 0.5 meters. Then, draw the array showing the element normals, element indices, and element taper shading.
Nelem = 7;
R = 0.5;
taper = taylorwin(Nelem);
sArray = phased.UCA(Nelem,R,'Taper',taper.');
w = getTaper(sArray);
viewArray(sArray,'ShowNormals',true,'ShowIndex','All','ShowTaper',true);
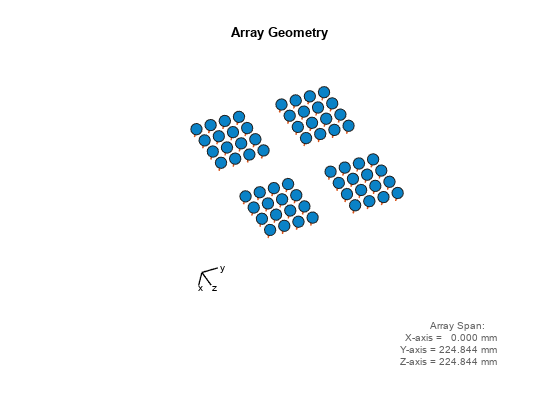
Construct a 5G antenna array where the grid is 2-by-2 and each panel is 4-by-4 array. Each antenna element consists of two short-dipole antennas with different dipole axis directions. The antenna elements are spaced 1/2 wavelength apart and the panels are spaced 3 wavelengths apart. The array operates at 6 GHz.
c = physconst('LightSpeed');
fc = 6.0e9;
lambda = c/fc;
antenna1 = phased.ShortDipoleAntennaElement('AxisDirection','Z');
antenna2 = phased.ShortDipoleAntennaElement('AxisDirection','X');
array = phased.NRRectangularPanelArray('ElementSet', ...
    {antenna1, antenna2},'Size',[4, 4, 2, 2], ...
    'Spacing',[0.5*lambda,0.5*lambda,3*lambda,3*lambda]);
viewArray(array,'ShowNormals',true, ...
    'ShowLocalCoordinates',true,'Orientation',[60;100;45], ...
    'ShowAnnotation',true)
Display the geometry of a 5-element heterogeneous ULA of cosine antenna elements, showing the indices for the first three elements.
sElement1 = phased.CosineAntennaElement('CosinePower',1.5);
sElement2 = phased.CosineAntennaElement('CosinePower',1.8);
sArray = phased.HeterogeneousULA(...
    'ElementSet',{sElement1,sElement2},...
    'ElementIndices',[1 2 2 2 1]);
viewArray(sArray,'ShowIndex',[1:3])
Display the element positions, normal directions, and indices for all elements of a 4-by-4 heterogeneous URA.
sElement1 = phased.CosineAntennaElement('CosinePower',1.5);
sElement2 = phased.CosineAntennaElement('CosinePower',1.8);
sArray = phased.HeterogeneousURA(...
    'ElementSet',{sElement1,sElement2},...
    'ElementIndices',[1 1 1 1; 1 2 2 1; 1 2 2 1; 1 1 1 1]);
viewArray(sArray,'ShowIndex','all','ShowNormals',true);

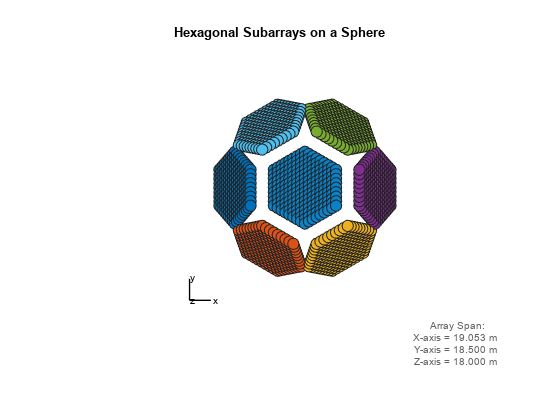
This example shows how to construct a full array by replicating subarrays.
Create a hexagonal array to use as a subarray.
Nmin = 9;
Nmax = 17;
dy = 0.5;
dz = 0.5*sin(pi/3);
rowlengths = [Nmin:Nmax Nmax-1:-1:Nmin];
numels_hex = sum(rowlengths);
stopvals = cumsum(rowlengths);
startvals = stopvals-rowlengths+1;
pos = zeros(3,numels_hex);
rowidx = 0;
for m = Nmin-Nmax:Nmax-Nmin
    rowidx = rowidx+1;
    idx = startvals(rowidx):stopvals(rowidx);
    pos(2,idx) = (-(rowlengths(rowidx)-1)/2:...
        (rowlengths(rowidx)-1)/2) * dy;
    pos(3,idx) = m*dz;
end
hexa = phased.ConformalArray(ElementPosition=pos,...
    ElementNormal=zeros(2,numels_hex));
Arrange copies of the hexagonal array on a sphere.
radius = 9;
az = [-180 -180 -180 -120 -120 -60 -60   0  0  60 60 120 120 180];
el = [-90   -30   30  -30   30 -30  30 -30 30 -30 30 -30  30  90];
numsubarrays = size(az,2);
[x,y,z] = sph2cart(deg2rad(az),deg2rad(el),...
    radius*ones(1,numsubarrays));
ha = phased.ReplicatedSubarray(Subarray=hexa,...
    Layout="Custom",...
    SubarrayPosition=[x; y; z], ...
    SubarrayNormal=[az; el]);
Display the geometry of the array, highlighting selected subarrays with different colors.
viewArray(ha,ShowSubarray=3:2:13,...
    Title="Hexagonal Subarrays on a Sphere");
view(0,90)
Display the geometry of a uniform linear array having overlapped subarrays.
Create a 16-element ULA that has five 4-element subarrays. Some elements occur in more than one subarray.
h = phased.ULA(16);
ha = phased.PartitionedArray(Array=h,...
    SubarraySelection=...
    [1 1 1 1 0 0 0 0 0 0 0 0 0 0 0 0;...
    0 0 1 1 1 1 0 0 0 0 0 0 0 0 0 0;...
    0 0 0 0 1 1 1 1 0 0 0 0 0 0 0 0;...
    0 0 0 0 0 0 0 0 1 1 1 1 0 0 0 0;...
    0 0 0 0 0 0 0 0 0 0 0 0 1 1 1 1]);
Display the geometry of the array, highlighting all subarrays.
viewArray(ha);
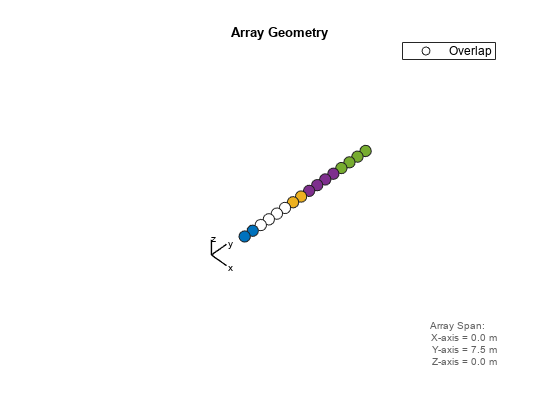
Each color other than white represents a different subarray. White represents elements that occur in multiple subarrays.
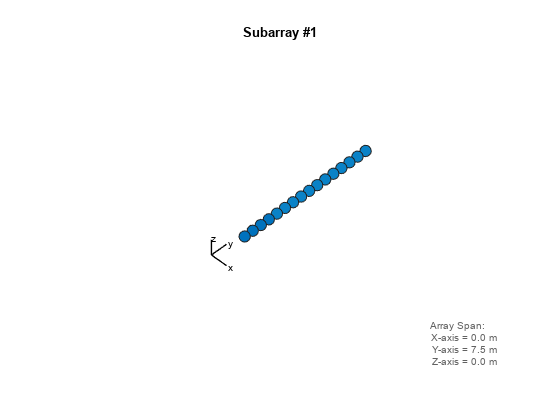
Examine the overlapped subarrays by creating separate figures that highlight the first, second, and third subarrays. In each figure, dark blue represents the highlighted elements.
for idx = 1:3
    figure;
    viewArray(ha,'ShowSubarray',idx,...
        Title=['Subarray #' num2str(idx)]);
end


Input Arguments
Name-Value Arguments
Output Arguments
Version History
Introduced in R2021a