Visualize and Monitor Logging Data by using Simulation Data Inspector
This example shows how to collect PLC run-time data for Rockwell Automation® targets. Set up an Open Platform Communications (OPC) server. Use the Simulation Data Inspector in Simulink® to visualize and monitor the logging data.
Set Up and Download Code to Studio 5000 IDE
Start the Studio 5000 IDE and create a project with the name
ext_demo1.Import the generated
ext_demo.L5Xto the Add-On Instructions tree node of the project. For more information, see Generate Structured Text Code That Has Logging Instrumentation.In the
MainProgramnode, delete the ladderMainRoutineand create an STMainRoutinenode.
In ST
MainRoutine, define the tags listed in this table.Tag Name Tag Type i0_SubsystemSubsystemi0_Subsystem_valSubsystem_logInitBOOLY1REALY2REALY3DINTIn Studio 5000 IDE,
i0_Subsystem tagis the instance of the top subsystem AOI and thei0_Subsystem_val tagis the logging data with structure typeSubsystem_log. Set the initial value ofinittag to 1.
Double-click the
MainRoutinetree node and type in the code in the image. The statementSubsystem(i0_Subsystem, 23, Y1, Y2, Y3, i0_Subsystem_val)calls the logging method(ssmethod value=23)to log in data to thei0_Subsystem_valtag.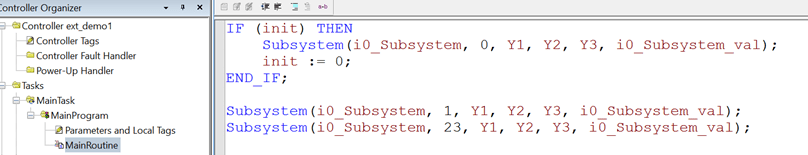
Compile the project in Studio 5000 IDE and download to the PLC target.
Configure RSLinx OPC Server
Start RSLinx Classic Gateway and select the menu item
DDE/OPC->Topic Configuration.In the dialog box, create a topic
ext_demo1by clicking theNewbutton. Select the target PLC from the PLC list.
Click the
Yesbutton to update the topic (ext_demo1).To verify that the log data is set up on the OPC server, select the menu item
Edit->Copy DDE/OPC Link. Thei0_Subsystem_valtag for log data must be shown on the RSLinx OPC Server.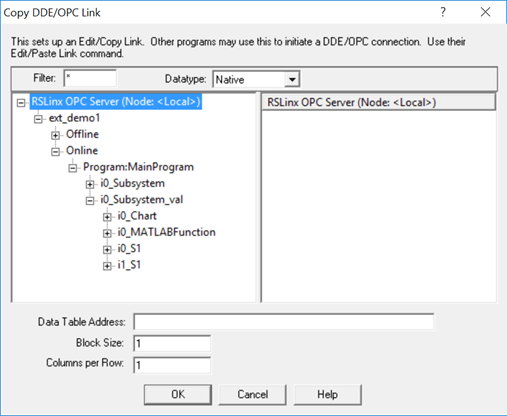
Stream and Display Live Log Data by Using PLC External Mode Commands
After the RSLinx OPC Server is configured, you can use the PLC external mode
commands to connect to the server, stream the logging data, and display live logging
data on the Simulation Data Inspector. The log data information is in the
plc_log_data.mat file, which you can find in the
plcsrc folder. You can use the plcdispextmodedata function to display the contents of the MAT-file.
In the MATLAB® Command Window,
type:
>>cd plcsrc
>>plcdispextmodedata plc_log_data.mat
Log data:
#1: Y1: LREAL
#2: Y2: LREAL
#3: Y3: LREAL
#4: io_Chart.out: DINT
#5: io_Chart.ChartMode: DINT
#6: io_Chart.State_A: BOOL
#7: io_Chart.State_B: BOOL
#8: io_Chart.State_C: BOOL
#9: io_Chart.State_D: BOOL
#10: io_Chart.is_active_c3_Subsystem: USINT
#11: io_MATLABFunction.y: LREAL
#12: io_MATLABFunction.i: LREAL
#13: io_S1.y: LREAL
#14: io_S1.UnitDelay_DSTATE: LREAL
#15: i1_S1.y: LREAL
#16: i1_S1.UnitDelay_DSTATE: LREAL
The format for the log data information is index number, name, and type. The log
data for non-top subsystem function block output and state variables is named by
using dot notation to represent the function block instances that own the data. You
can use the index and name of the log data with the plcrunextmode
command to specify a subset of log data for streaming and visualization.
To connect to the OPC server and stream log data, use the plcrunextmode function. For example, executing the
plcrunextmode ('localhost', 'studio5000', 'ext_demo1',
                    'plc_log_data.mat');
command streams live log data for the example
model into Simulation Data Inspector.

The plcrunextmode command continues to run and stream log data.
To exit streaming, at the MATLAB command prompt, type Ctrl-C.
See Also
plcdispextmodedata | plcrunextmode