Import, View, and Export Point Cloud
R2026bImport Data
You can import point cloud data from PLY, PCAP, LAS, LAZ, PCD, E57, or rosbag files,
or any custom source, into the Point Cloud
Analyzer app. You can also import pointCloud objects from the MATLAB® workspace.
Use these steps to import point cloud data.
On the app toolstrip, select Import > From File. Choose a data source from the list.
In the Import dialog box, specify the location of the point cloud data from the selected data source.
Select this option to import data from various lidar sensors such as Velodyne® and Ouster® lidars.
In the Import PCAP File dialog box, select the type of lidar sensor from the Source Type list. In the Provide path to a PCAP file box, specify the path or browse to the folder containing your data. In the Provide path to a calibration file box, specify the path or browse to the folder containing the calibration file of the sensor.
When you select the Source Type as
Velodyne LidarorHesai Lidar, select the device model name from the Device Model list.When you select the Source Type as
Hesai LidarorOuster Lidar, you can also select the return mode of the point cloud data from the Return Mode list.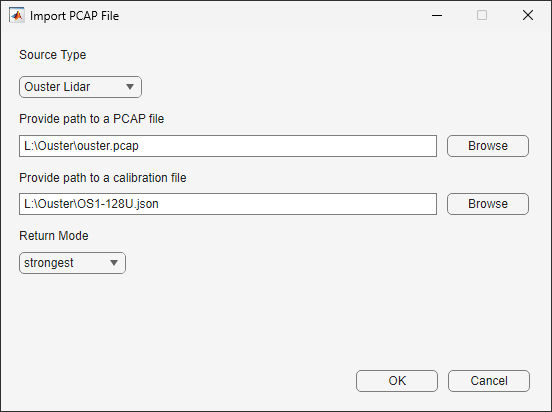
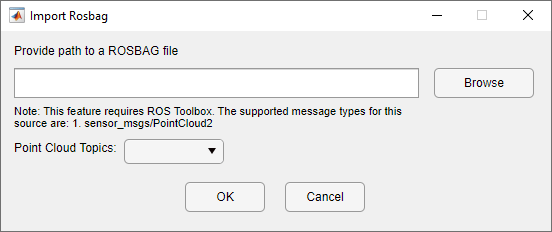
For rosbag files, select the topics that contain point cloud data from the Point Cloud Topics list. In the Provide path to a ROSBAG file box, specify the path or browse to the folder containing your data. To load data from a rosbag file, you must have a ROS Toolbox license.
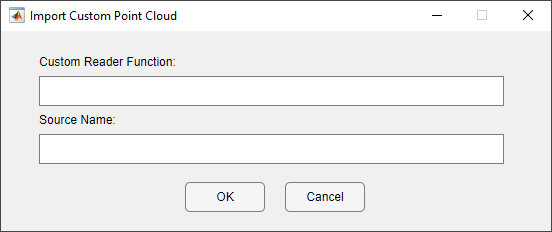
To load point cloud data from a custom source, create a custom reader function and add it to your MATLAB path. In the Custom Reader Function box specify the path to the reader function, and in the Source Name box specify the path to the data folder.
To load point clouds from the workspace, select Import > From Workspace on the app toolstrip. In the Import From Workspace dialog box that appears, select the variables or objects from the workspace you want to import.
You can also select a variable that refers to an array of
pointCloudobjects. The app loads the array as a sequence of point clouds. (since R2026b)
View Data
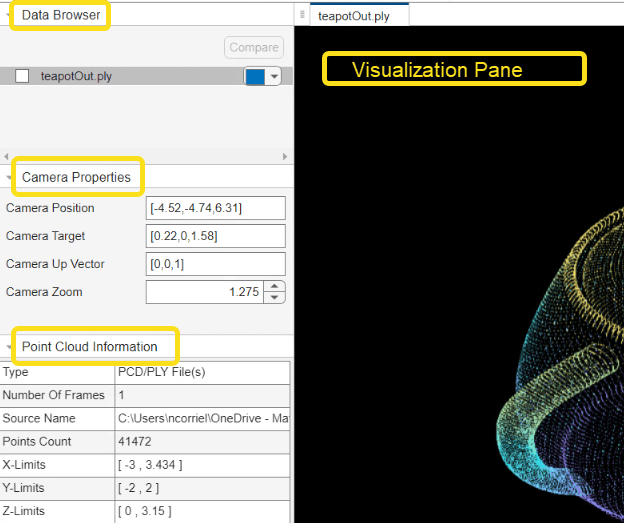
The app lists the loaded data in the Data Browser. When you select any point cloud signal from the Data Browser, the app displays it in the visualization pane.
The Camera Properties tab displays the tunable camera information, such as camera position, target vector, and percentage zoom. You can change these properties to view the point cloud from different camera angles. For more information on the camera properties, see Camera Graphics Terminology.
The Point Cloud Information pane displays the metadata of the selected point cloud.
To delete the imported data, right-click the data you want to delete and select Delete Data.
Tip
You can adjust the point cloud view by using the x-, y-, and z-axes at the bottom-left corner of the visualization pane.

Play Point Cloud Sequence
If the input data contains multiple point cloud frames, the visualization pane displays a sequence of point clouds and the Playback Slider, which contains playback controls.

The app provides these playback controls. The buttons, from left to right, are:
First Frame
Previous Frame
Play
Next Frame
Last Frame
For point cloud data with timestamp information, such as PCAP files and rosbags, the app displays the Start Time, Current Time, and the End Time on the Playback Slider.
Note
The app does not show the Playback Slider if the input data contains only one point cloud frame.
Overlay Point Clouds
Use the overlay option to view multiple point clouds in the same visualization pane.
On the Analyzer tab of the app toolstrip, select Overlay. The app displays all imported point clouds
overlaid in the visualization pane. To hide individual point clouds from the
overlay, click the  in front of that point cloud in the
Data Browser pane. The app hides the corresponding point
cloud, and displays the
in front of that point cloud in the
Data Browser pane. The app hides the corresponding point
cloud, and displays the  icon instead. Select it to again visualize the
associated point cloud.
icon instead. Select it to again visualize the
associated point cloud.
Compare Point Clouds
Compare two point clouds to compute and visualize differences.
On the Analyzer tab of the app toolstrip, select Compare. The app opens the Compare
tab and displays an empty Point Cloud Difference view in the
visualization pane. In the Compare tab, select the
Reference and Target point clouds.
Select an attribute for comparison, such as Location,
Intensity, or an individual axis
(X, Y, or
Z), and then click Calculate
Difference.
The app displays the differences as a heatmap in the Point Cloud Difference view in the visualization pane. A colorbar shows the mapping between colors and difference values. To show or hide the colorbar, toggle the Show Colorbar button on the app toolstrip. You can also refine the heatmap range by specifying the minimum distance and maximum distance values in the Distance Heatmap section of the toolstrip. Alternatively, adjust the markers on the colorbar to limit the heatmap range. Points within the selected range appear in heatmap colors in the visualization pane, while points outside the range appear in their original color, or in gray if the original color is unavailable.

After you calculate the difference, the app displays metrics in the Comparison Metrics pane such as the RMSE, Chamfer distance, Hausdorff distance, and standard deviation.
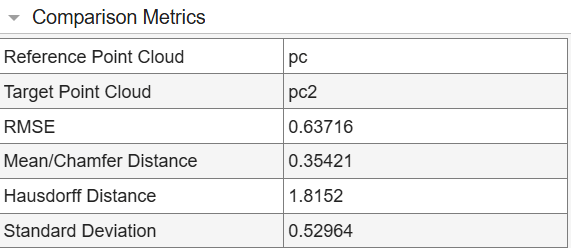
You can use Compare to compare an edited point cloud with the original one. For information on how to edit a point cloud in the app, see Edit Point Cloud.
Note
A Windows® OS machine must have WebGL™ 2 support for graphics rendering.
Export Data
To export your point clouds after processing them, from the app toolstrip, select Export Point Cloud. The Point Cloud Analyzer app opens the Export Point Cloud dialog box.
Select the point clouds you want to export. In the Provide path to the destination folder box, specify or browse to the destination folder. You can export point clouds as PCD, PLY, LAS, or LAZ files.
You can later load the exported file into the app interactively. Alternatively, at the
MATLAB command prompt, you can use this syntax, where fileName
is the name of the exported file, including its file extension.
pointCloudAnalyzer(fileName)
If the specified file is not on the MATLAB search path, you must specify the full file path.

