Run Polyspace as You Code in Visual Studio Code and Review Results
Run a Polyspace® as You Code™ analysis to identify critical defects and security vulnerabilities early in the development process. Polyspace as You Code is integrated as a plugin into your IDE allowing you to run an analysis and displays the results of your analysis without switching between applications. You can choose to run Polyspace as You Code automatically every time you save a file in Visual Studio Code, or manually on-demand. The analysis runs on the file that is currently active in the IDE. After analysis, you see defects and coding standard violations as source code markers and as a list in the Problems view.
Start the Polyspace as You Code Extension
To start the Polyspace as You Code extension, open a C or C++ file in the editor. The extension does not start automatically when you open Visual Studio Code until a C or C++ file is open in the editor.
Note
The Polyspace as You Code extension is disabled when you open a folder in Restricted Mode. To enable the extension, mark the folder as trusted. See Workspace Trust.
For better performance on Windows® systems, the files that you analyze should not be stored on network drives.
Once you start the extension, Polyspace as You Code displays icons in the status bar (lower left) to provide information about the state of the extension, such as errors in the configuration or whether an analysis is running on the currently selected file.
Place your cursor over an icon to view a tooltip containing additional information.
Click an icon (when applicable) to perform common operations, such as opening the extension settings or viewing the Problems view.
The information that you see in the status bar is either global (![]() ) or specific to the currently selected file (
) or specific to the currently selected file (![]() ). The file specific status bar icons update when you
select a different file.
). The file specific status bar icons update when you
select a different file.
To disable or reenable the Polyspace as You Code status bar icons, right-click the icons and select the appropriate option from the menu.
Run Analysis
You can run a Polyspace as You Code analysis in two ways: when you save a file that is in the Quality Monitoring view, or manually on-demand.
Run Analysis On Save
By default, Polyspace as You Code adds the current file to the Quality Monitoring view when you save the file, but does not start the analysis.
To enable the analysis of the current file when you save the file, click ![]() in the Quality Monitoring
view and in the Options dialog box, select the checkbox for Analysis Of
Files On Save.
in the Quality Monitoring
view and in the Options dialog box, select the checkbox for Analysis Of
Files On Save.
In case of an error, you see a popup with the error message. To diagnose further, select View > Output. On the Output view, from the dropdown on the upper right, select Polyspace as You Code.
If results do not appear, see Troubleshoot Failed Analysis or Unexpected Results in Polyspace as You Code.
Run Analysis Manually
To disable starting an analysis when you save a file, click ![]() in the Quality Monitoring
view and then clear the Analysis Of Files On Save checkbox.
in the Quality Monitoring
view and then clear the Analysis Of Files On Save checkbox.
To start an analysis manually, do one of the following:
Hover over a file in the Quality Monitoring list and select the Run Polyspace Analysis
 icon.
icon.Click
 in the Quality
Monitoring view to run an analysis on each file in the
Quality Monitoring list sequentially.
in the Quality
Monitoring view to run an analysis on each file in the
Quality Monitoring list sequentially. With your cursor in the source file, press Ctrl + Shift + Alt + A.
Review Results
After analysis, the results appear in two forms:
As source code markers (with a wavy line below source code tokens).
You can hover on a source code token to see more details about a result.
As a list in the Problems view.
To open the view, select View > Problems. The Problems view lists all issues or results for a file. To show only Polyspace results, in the text filter in the Problems view, enter the text
Polyspace.If you select a result in the Problems view, you see additional details about the result in the Result Details view. Click
 to open the contextual help for the
currently selected result.
to open the contextual help for the
currently selected result.
Double-click a result in the Problems view to navigate to the corresponding source code. If the analysis fails, check the messages in the Output view to diagnose the cause of the failure.
If results do not appear, see Troubleshoot Failed Analysis or Unexpected Results in Polyspace as You Code.
View Context-Sensitive Help for Result
You can see more information on a type of result by visiting the context-sensitive help page for the result.
To open the context-sensitive help for a result, select that result in your code
or in the Problems view, and then click ![]() in the Result Details
view.
in the Result Details
view.
You can also view the context-sensitive help for any Polyspace
as You Code result by going to the Command Palette
(Ctrl + Shift + P) and
selecting Polyspace: Open Contextual Help. Choose a result
family from the menu and then enter a result name, for instance
UNMODIFIED_VAR_NOT_CONST.
Open the full searchable documentation for the Polyspace
as You Code extension in your system browser by clicking ![]() in the Baseline,
Configuration, or Quality Monitoring
view.
in the Baseline,
Configuration, or Quality Monitoring
view.
Apply Suggested Fix for Common Defects or Coding Rule Violations
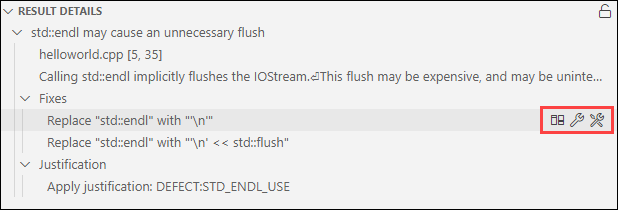
If Polyspace reports certain common defects or coding rule violations in your code, the Polyspace as You Code extension proposes one or more fixes that you can apply to these results.
To apply a suggested fix, first select the result in the editor or in the Problems view. Suggested fixes appear in the Result Details view. Point to a suggested fix and select Fix the current result to apply the suggested fix to the selected result.
You can also apply a suggested fix from the light bulb menu. The quick fix options
have the format Fix checkerName:
proposedFix. Here,
checkerName is the name of the selected defect
checker or coding rule, and proposedFix is the fix that
Polyspace applies to your code. Polyspace edits your code and fixes the issue or all instances of the issue in
the currently active file, depending on the option that you select. If there is more
than one proposed fix, you see all available fixes in the menu.

This table lists the common defects and coding rule violations for which Polyspace proposes a fix, along with the Polyspace checkers that report these issues.
| Common Defect or Coding Rule Violation | Polyspace Checkers That Report the Issue |
|---|---|
Function that could be evaluated a compile time missing
constexpr specifier |
|
Inefficient use of std::any_cast to cast
object by value |
|
Inefficient use of std::string
operator+() |
|
Inefficient use of the [] operator to
insert or assign a value to a key in a
std::map or
std::unordered_map (C++ 17 and later
only) |
|
| Parameter passed by value results in expensive copy |
|
| Unmodified expensive-to-copy parameter passed by value |
|
Unmodified local variable is created by expensive copy from a
const reference |
|
Unmodified variable not declared
const |
|
Unnecessary call to std::move in a return
statement |
|
| Unused include |
|
| Unused parameter |
|
Use of std::endl |
|
Justify Results Using Code Annotations
If you decide not to fix a result, you can add code annotations to the result to
avoid having to fix the result again. If the annotations follow a specific syntax,
subsequent Polyspace
as You Code runs can read these annotations and suppress the corresponding
results. You can unsuppress these justified results in the
Problems view by clicking the Show justified and
unjustified ![]() icon in the Baseline
view.
icon in the Baseline
view.
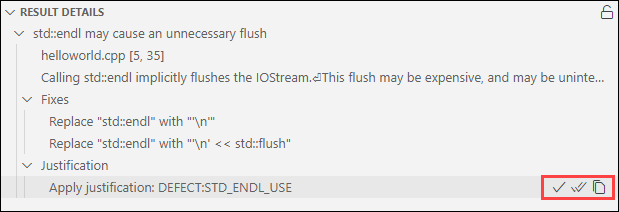
To apply a justification, first select a result in the editor or the Problems view. Justifications appear in the Result Details view. Point to a justification and select one of these options:
Justify the current result — Append a justification annotation to the selected result.
Justify all instances of the selected finding — Append a justification annotation to all instances of the same defect or coding rule violation in the current file.
Copy to clipboard — Copy the family and acronym of the result to your clipboard. You can use this information to create a justification catalog. See Use a Justification Catalog to Autocomplete Annotations in Polyspace as You Code Plugins.
You can also apply a justification from the light bulb menu.
Click the light bulb icon beside the source code token containing a result and select Justify
result_namewith annotation. The annotation is entered on the same line as the result.To mass-justify results of the same defect or coding rule violations in the current file, select an instance of that result and click the Justify all
result_nameoption from the light bulb menu. Polyspace inserts an annotation in your code on each line that contains this result.If you import review information from a baseline run, select Annotate
result_namewith baseline comment to include any status, severity, or comment assigned to that result in the baseline run. If the imported status is set toTo investigate,To fix, orOther, the annotation does not suppress the result.
If you select multiple lines of code, the light bulb menu show annotation options for each result in your selection.
Polyspace
as You Code inserts code annotations as comments enclosed in "/*
*/" for C files and prefixed with "//" in C++ files
(C++ style). The comment format in C files complies with MISRA C:2004 rule
2.2.
Justified results are removed from the Problems view and are suppressed in subsequent analyses.
You can import your own justification catalog as a JSON file that uses the Polyspace code annotation syntax. For details, see Use a Justification Catalog to Autocomplete Annotations in Polyspace as You Code Plugins.