Parse Source Code for Auto-Populating Test Information in Polyspace Platform User Interface
To author unit tests for C/C++ functions in the Polyspace Platform user interface, you first create a project and add your source files to the project. Before authoring tests, you must perform a light analysis of the source files to extract all information required for authoring tests. When you author tests later, most information from the code is automatically filled in, and you only have to provide test data such as input values.
Prerequisites
Before analyzing source code, you must setup a C/C++ compiler in the Polyspace® Platform user interface. For more information, see Specify C/C++ Compilers for Testing in Polyspace Platform User Interface.
Analyzing Source Code
To analyze source files added to a project:
Select Parse Code on the Polyspace Platform toolstrip.
Alternatively, on the Projects pane, right-click the Code node of a project and select Parse Code.
Follow the progress of analysis on the Parsing code window.
After code analysis, you can see the following:
Functions per file below the Code node on the Projects pane.
An overview of the code on the Code pane. To see this overview, select the Code Explorer button
 on the Polyspace Platform toolstrip.
The code analysis is performed per file.
Only those files that were modified since the previous analysis are parsed. The remaining files show code analysis information based on the previous code parsing.
You can force full analysis of the code in the project using one of these actions on the Polyspace Platform toolstrip:
Select Reparse Code instead of Parse Code.
Select Clean Parsing Artifacts to remove previous code analysis information and then select Parse Code.
If one or more files fail to parse because of compilation failures, you can still author tests for functions in the remaining files. The compilation failures are displayed as errors in the code parsing logs.
Global Information Extracted in Code Analysis
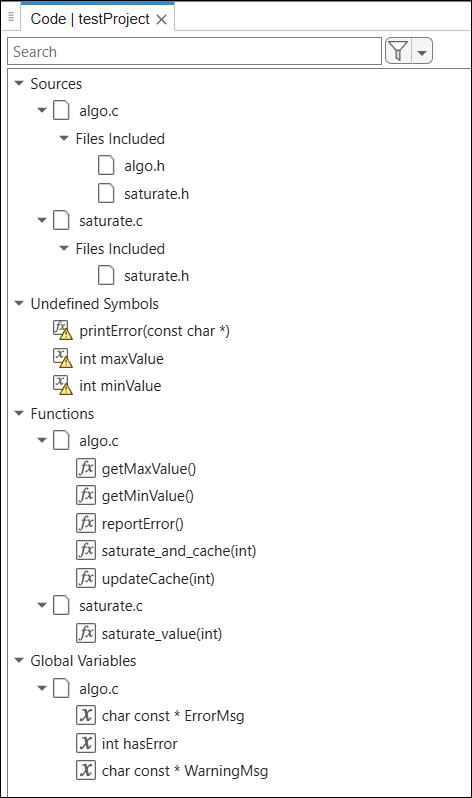
On the Code pane, after code analysis, you can see the following global information:
Sources: Source files in the project. For every source file, under a Files Included node, you can see headers included in a source. You can also see system headers by right-clicking a file and selecting Show System Includes.
Undefined Symbols: Functions and global variables which were declared but whose definitions were not found. You can create stubs for these functions and variables by right-clicking the function and selecting Create Stub. For more information, see Test Functions with Undefined Callees in Polyspace Platform User Interface.
Stubbed Symbols: Functions and global variables which you stubbed. For more information on stubbing, see Test Functions with Undefined Callees in Polyspace Platform User Interface.
External Symbols: Functions and global variables which you explicitly marked as external. The definitions of these symbols are not present in the code added to the project but are available at build time, for instance, in a dynamically linked library. For more information, see
External symbols.Functions: Functions per file in the project. You can start authoring a test or a mock for a function by right-clicking the node corresponding to the function.
Global Variables: Global variables in the project.
Types: User-defined types classified as:
Struct
Typedef
Enum
Union
Class
A typical snapshot of the Code pane looks like the following.
Filter Information
You can use search and named filters to narrow down the list displayed on the Code pane. For instance:
You can search for a string to see only the names of symbols (variables, functions, and so on) containing that string.
You can select the Undefined Symbols filter to show only undefined symbol names.
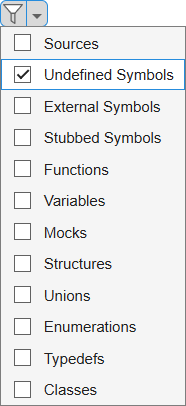
You can click on the filter icon
 to toggle between a filtered list and the full
list.
to toggle between a filtered list and the full
list.
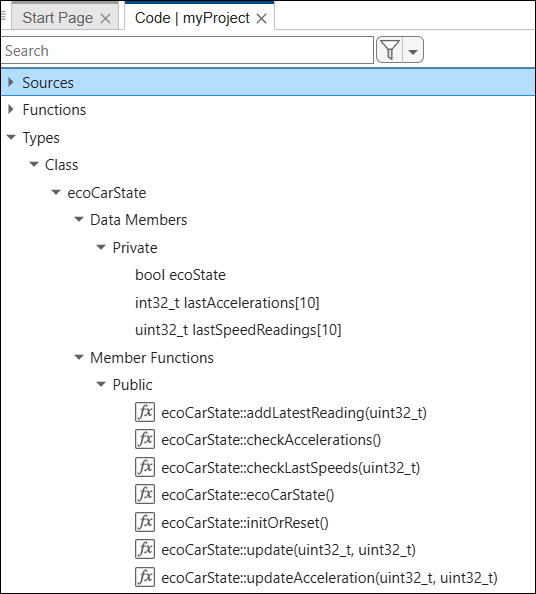
View Details
You can select a node to see further details on the right. For instance, under the node Types > Class, for each class, you can see the class data members and member functions grouped by access modifier (private, public or protected).
You can select a class name or the name of a data member or member function to see further information such as:
Fully qualified name.
Name of file containing the class, data member or member function definition.
Test information, such as:
Whether the function is supported for graphical test authoring.
Graphical test steps in which the function is invoked as code under test.
graphical test steps in which a function is being called as code under test.
Other attributes such as:
Whether the class is an abstract class, a template class, or the final class in an inheritance hierarchy.
Whether the data member is static.
Whether the member function is static, abstract or virtual.
You can also see the code with the definition of the class, data member or member function.
Per Function Information Extracted in Code Analysis
The code analysis also extracts information about the interface of each function, that is, the function parameters, return value and other side effects (such as global variables read and written by a function). When authoring a test, you can pick a function to test and the information about the function interface is automatically populated.
For instance, in the following test authoring view, when the function
saturate_and_cache is selected for Code Under
Test, the Inputs and Assessments
sections are automatically filled.
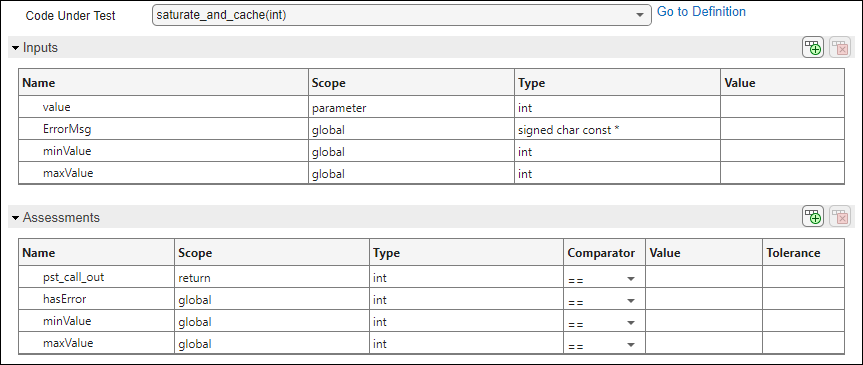
The Inputs section contains this information:
Function parameters (along with their data types).
To complete the input authoring, you have to enter the parameter value in the Value column.
Global variables directly or indirectly read by the function (along with their data types). An indirect read happens when the global variable is read by one of the function callees, direct or indirect.
If a global variable is initialized in the code, you can call the function to test with the global variable set to its initialization value. In this case, leave the entry in the Value column to
<<default>>. Otherwise, to complete the input authoring, you have to enter the global variable value in the Value column.
The Scope column distinguishes function parameters from global variables.
The Assessments section contains this information:
Function return value (along with its data type). The return value is assigned a name
pst_call_out.To complete the assessment authoring, you have to enter the expected function return value in the Value column and select
==in the Comparator column. In some cases, instead of a precise expected return value, you might want to test if the return value is above, below or not equal to a certain value. In this case, enter a comparator other than==in the Comparator column.Global variables directly or indirectly written by the function (along with their data types). An indirect write happens when the global variable is written by one of the function callees.
If the global variable is initialized in the code, you can specify that the variable must remain at its initialized values after the function call. In this case, leave the entry in the Value column to
<<default>>and select==in the Comparator column. Otherwise, to complete the assessment authoring, you have to enter the expected value of the global variable after the function call in the Value column.
All assessments are optional. For instance, you might choose to specify an assessment on the function return value only. In that case, delete the rows for the global variables.
Besides inputs and assessments, an additional Callees section lists the callees of the function under test. You can use this section to see if any of the callees are undefined and require stubbing. Undefined functions are shown with a warning icon.