Review C/C++ Code Sanitizer Results
R2026bWhen you run C/C++ tests with a code sanitizer enabled, the sanitizer instruments expressions that might cause numerical errors or memory management issues at run time. If any of these issues actually occur during test execution, they are reported as test failures. In addition, a set of sanitizer profiling results lists all instrumented expressions and indicates whether a failure was detected for each one.
This topic shows how to open and review your code sanitizer results. For more information on enabling the code sanitizer and running tests, see Run C/C++ Code Sanitizer and Review Results in Polyspace Platform User Interface.
Open Code Sanitizer Results
You can open code sanitizer results in the Polyspace Platform user interface or in the Polyspace® Access™ web interface:
You can see code sanitizer results after building and running tests in the Polyspace Platform user interface with the code sanitizer enabled.
In the Polyspace Platform user interface, once you have sanitizer results open, the Results pane contains a Sanitizer Profiling node. You can right-click this node and open a summary of results in the Dashboard perspective or more detailed information in the Review perspective.
For more information, see Open Polyspace Results in Polyspace Platform User Interface.
You can upload code sanitizer results to a Polyspace Access web server, and review the results in a web browser.
In the Polyspace Access web interface, you see sanitizer results in the Project Explorer pane. You can select a sanitizer result set to open a summary of results in the Dashboard perspective or select the Review button on the toolstrip to open more detailed information in the Review perspective.
For more information, see Upload Results to Polyspace Access.
You see the same display of code sanitizer results in the Polyspace Platform user interface and the Polyspace Access web interface.
You can also review code sanitizer results in an HTML report. For more information on the HTML report, see Structure of HTML Reports Generated from C/C++ Code Sanitizer Results.
See Overview of Sanitizer Results on Dashboard
In the Dashboard perspective, the Project Overview dashboard shows in the Sanitizer Profiling section how many expressions caused errors during test execution and how many did not.
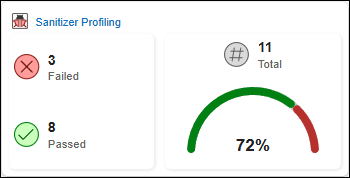
You can also select Sanitizer Profiling on the toolstrip to see a file-by-file breakdown of the sanitizer profiling results.

See Details of Sanitizer Results
On the toolstrip, select Review to see detailed information about sanitizer profiling results. The sanitizer profiling results show a list of expressions that were identified as potential failure points. For each expression, the results show possible errors that the expression can cause. For each error, you see how many tests ran into the error with one example.
The sanitizer profiling review app opens with a three-pane layout:
The Results List pane on the left shows a hierarchical tree that organizes results by run, file, function, and expression. For each expression, the tree shows the result status and a description of the potential error.

Note that memory leaks are reported under a Global Scope node instead of a specific file since a memory leak might be associated with more than one file (the leak location might be in a different file from the memory allocation).
Selecting a result on the Results List pane opens the Result Details pane. This pane shows details of the selected expression, including the type of check, the code expression, and the defect message. For individual expressions, you also see lists of tests that passed and failed for that expression.

The result message is followed by a list of events:
For all checks, you see an event below the result message indicating the line where the issue occurred. If you navigate away from this line, you can click the event to return to the original line.
For certain checks, you see additional events pointing to other lines relevant to the issue. For instance, for memory leaks, you see an event pointing to the line where the memory was allocated (in addition to the line where the leak occurred).
For more information on the types of issues found, see Issues Detected Using Polyspace Test Code Sanitizer.
Selecting a result on the Results List pane also opens the Source Code pane with the relevant function/expression highlighted. This pane displays the source file with inline decorations highlighting expressions based on their result status. Hover over an expression to see a tooltip with details of the checks performed on that expression.
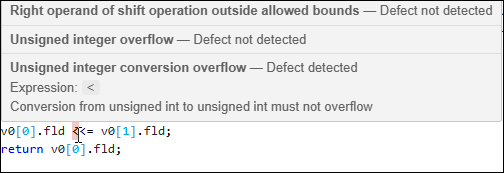
Use the toolstrip and filter toolbar to narrow results. Select Filter by Result to toggle visibility of results by status:
Defect detected – Expressions where at least one test triggered a run-time error.
Defect not detected – Expressions that were exercised by tests but no error was detected.
Not executed – Expressions that were instrumented but not exercised by any test.
Not available – Expressions where the sanitizer did not instrument code for defect detection.

You can also use the Show only and Filter out text fields to include or exclude results by filename, function name, or expression text.

