主要内容

updateDetector

Update settings of a trained time series machine learning anomaly detector and recompute detection threshold

Since R2026a

Description

Add-On Required: This feature requires the Time Series Anomaly Detection for MATLAB add-on.

Set New Threshold Manually

detector = updateDetector(detector,ThresholdMethod="manual",Threshold=Threshold) sets the threshold manually to the scalar value Threshold that you specify. Use this syntax when you want to adjust the threshold directly rather than recompute it from input time series data.

For examples that you can open and experiment with, see Use UpdateDetector to Tune Anomaly Detector Performance Without Retraining.

example

Recompute Threshold Using New Data

detector = updateDetector(detector,data) recomputes the threshold of the trained detector detector using the data in data and the current settings of the detector model, as long as detector.Threshold is not set to "manual".

Use this syntax when you want to compute the threshold using a different set of data than the original training data. The data data that you use must consist only of only normal data, that is, that contains no known anomalies or anomalous data.

Set Additional Options

detector = updateDetector(___,Name=Value) sets additional options using one or more Name=Value arguments. These options set the corresponding properties of detector, include thresholding and execution-related properties. The options you can set depend on the detector model you are updating.

Note that, when you use updateDetector, there are no default values for model settings, as the model is already configured. You must explicitly specify any settings, such as the threshold method and the corresponding threshold parameter, that differ from the initial detector settings.

For example, suppose you first create a time series isolated forest detector model using the "kSigma" threshold method, which has an associated default threshold parameter of 3. After viewing the results, you decide to try the "ContaminationFraction" method instead, using a threshold parameter value that identifies the top 5% of the anomaly scores as anomalous. To do so, use the following command. detector = updateDetector(detector,data,ThresholdMethod="contaminationFraction",ThresholdParameter=0.05).

Examples

collapse all

Suppose that you have a trained isolated forest detector model, and you want to try to improve performance by updating the threshold with a specific value that you specify.

The current detection performance and the anomaly scores are shown in the following figures.

Detected anomalies for Channels 1, 2, and 3 from top to bottom.

Anomaly score for Channel 3. A dashed horizontal line illustrates where the threshold is with respect to the scores.

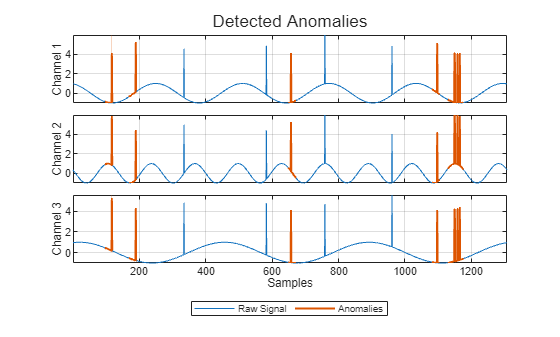
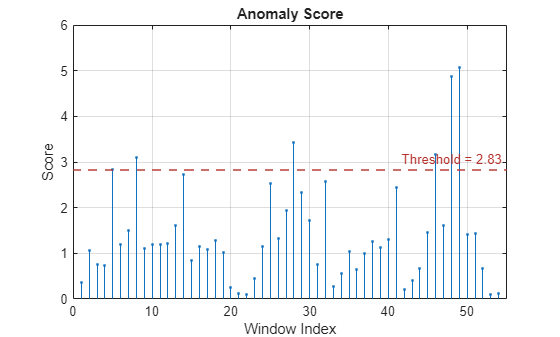
In the top plot, the anomaly appears as vertical spikes against a smooth sinusoidal signal. Red spikes indicate detections. Blue spikes indicate undetected anomalies. In the bottom plot, the horizontal threshold line is higher than some of the anomaly spikes, causing the detector to miss the lower-score anomalies.

Change the threshold to 2.0 by using the following commands.

detector_iforest = updateDetector(detector_iforest,ThresholdMethod="manual",Threshold=2.0);
results = detect(detector_iforest, sineWaveAbnormal);
plot(detector_iforest,sineWaveAbnormal{3})

Assess the resulting detection and anomaly score plots.

The Detected Anomalies plot shows that all anomalous spikes are red

The Anomaly Score plot shows that the threshold is lower than the anomalies.

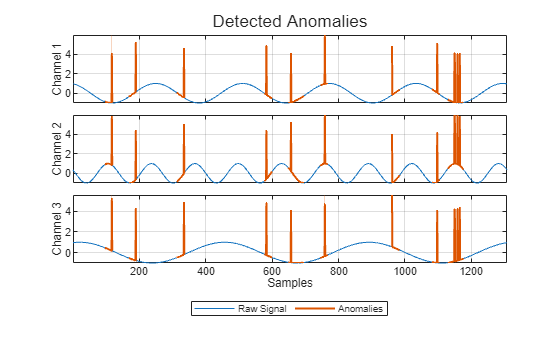
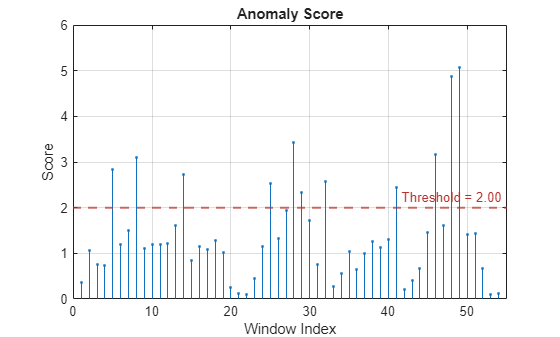
With the new threshold, the detector recognizes all the spikes as anomalies.

Input Arguments

collapse all

Anomaly detector model, specified as a TimeSeriesIForestDetectorTimeSeriesRRCForestDetector, TimeSeriesLOFDetector, or TimeSeriesOCSVMDetector object.

Time series data to be used for updating the threshold, specified as a matrix, a cell array, or a timetable. data must consist of only normal data, with no known anomalies or anomalous data.

When data contains m sets of signals, each of which contain n = detector.NumChannels channels, the possible formats are these:

  • n-column matrix that consists of a single multichannel signal (m=1).

  • Cell array with m cells that each contain a matrix that has NumChannels columns.

  • Timetable that contains a single multichannel signal , arranged in one of two possible ways.

    • The n channels are distributed in the columns of a matrix that the timetable contains in a single variable

    • The n channels are represented by n timetable variables that each contain a vector.

    In either case, the timetable must contain finite, increasing, and uniformly sampled time values.

Name-Value Arguments

expand all

Specify optional pairs of arguments as Name1=Value1,...,NameN=ValueN, where Name is the argument name and Value is the corresponding value. Name-value arguments must appear after other arguments, but the order of the pairs does not matter.

Example: detector = updateDetector(detector,data,ThresholdMethod="manual",Threshold=TH) replaces the computed threshold value for detector to the manual threshold TH.

All Detectors

expand all

Method to compute the detection threshold, specified as one of these values, each of which correspond to what the detection threshold is based on:

  • "kSigma" — Standard deviation of the normalized anomaly scores. The parameter k determines the threshold within the standard deviation levels that identifies an anomaly. The value of k is specified by ThresholdParameter.

  • "contaminationFraction" — Percentage of anomalies within a specified fraction of windows, measured over the entire training set. The fraction value is specified by ThresholdParameter.

  • "max" — Maximum window loss measured over the entire training data set and multiplied by ThresholdParameter

  • "mean" — Mean window loss measured over the entire training data set and multiplied by ThresholdParameter

  • "median" — Median window loss measured over the entire training data set and multiplied by ThresholdParameter

  • "manual" — Manual detection threshold value based on Threshold.

  • "customFunction" — Custom detection threshold method based on ThresholdFunction.

If you specify ThresholdMethod, you can also specify ThresholdParameter, Threshold, or ThresholdParameter. The available threshold parameter depends on the specified detection method.

Anomaly score used to detect anomalies, specified as a positive scalar. The source of the Threshold value depends on the setting of ThresholdMethod.

  • If ThresholdMethod is "manual", you set the value.

  • If ThresholdMethod is "customFunction", the function specified in ThresholdFunction computes the value.

  • For other values of ThresholdMethod, use ThresholdParameter to specify the detection threshold.

Parameter used for determining the detection threshold, specified as a numeric scalar.

The way you specify ThresholdParameter depends on the specified value for ThresholdMethod. The following list describes the specification of ThresholdParameter for each possible value of ThresholdMethod

  • "kSigma" — Specify ThresholdParameter as a positive numeric scalar. A typical value for ThresholdParameter in this case is 3.

  • "contaminationFraction" — Specify ThresholdParameter as a as a nonnegative scalar less than 0.5. For example, if you specify "contaminationFraction" as 0.05, then the threshold is set to identify the top 5% of the anomaly scores as anomalous.

  • "max", "mean", or "median" — Specify ThresholdParameter as a positive numeric scalar. If you do not specify ThresholdParameter, A typical value for the parameter in this case is 3.

  • "customFunction" or "manual"ThresholdParameter does not apply.

Function to compute custom detection threshold, specified as a function handle. This argument applies only when ThresholdMethod is specified as "customFunction".

  • The function must have two inputs

    • The first input is a vector of scalar window anomaly scores.

    • The second input is a vector representing all point-level anomalies.

  • The function must return a positive scalar corresponding to the detection threshold.

Window length of each time series segment, specified as a positive integer scalar.

Version History

Introduced in R2026a