blakechart
Range-angle-height (Blake) chart
Description
blakechart(
creates a range-angle-height plot (also called a Blake chart) for a narrowband radar
antenna. This chart shows the maximum radar range as a function of target elevation. In
addition, the Blake chart displays lines of constant range and lines of constant height.
The input consists of the vertical coverage pattern vcp,vcpangles)vcp and vertical
coverage pattern angles vcpangles, both produced by radarvcd.
The range in the range-height-angle chart is the propagated range and the height is relative to the origin of the ray. It is assumed that the antenna height is less than 1000 ft (about 305 meters) above ground level. Normal atmospheric refraction is taken into account using the CRPL Exponential Reference Atmosphere Model. Scattering and ducting are assumed to be negligible.
blakechart(___, allows you to
specify additional input parameters using name-value arguments. You can specify multiple
name-value arguments in any order with any of the previous syntaxes.Name,Value)
Examples
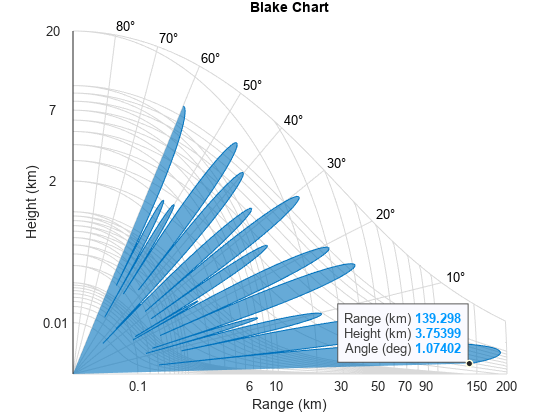
Display the vertical coverage diagram of an antenna transmitting at 100 MHz and placed 20 meters above the ground. Set the free-space range to 100 km. Use default plotting parameters.
freq = 100e6;
ant_height = 20;
rng_fs = 100;
[vcp, vcpangles] = radarvcd(freq,rng_fs,ant_height);
blakechart(vcp, vcpangles);
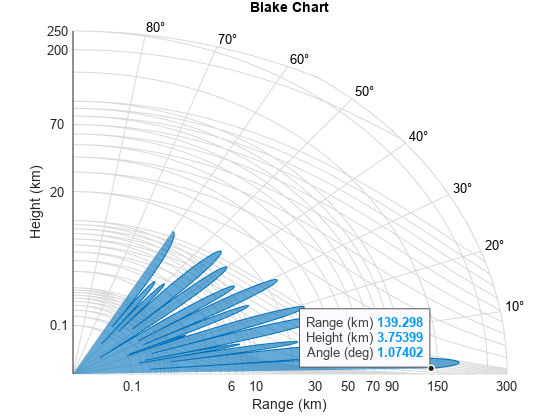
Display the vertical coverage diagram of an antenna transmitting at 100 MHz and placed 20 meters above the ground. Set the free-space range to 100 km. Set the maximum plotting range to 300 km and the maximum plotting height to 250 km.
freq = 100e6;
ant_height = 20;
rng_fs = 100;
[vcp, vcpangles] = radarvcd(freq,rng_fs,ant_height);
rmax = 300;
hmax = 250;
blakechart(vcp,vcpangles,rmax,hmax)
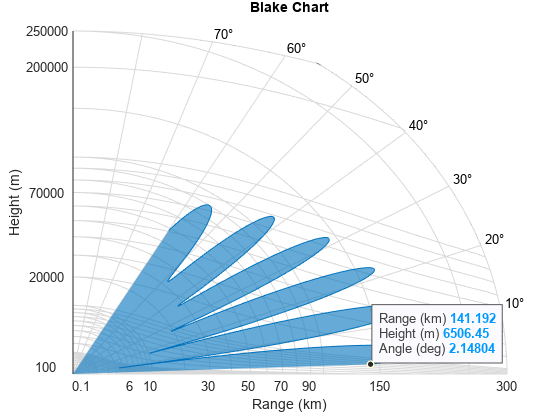
Plot the range-height-angle curve of a radar having a sinc-function antenna pattern.
Specify antenna pattern
Specify the antenna pattern as a sinc function.
pat_angles = linspace(-90,90,361)';
pat_u = 1.39157/sind(90/2)*sind(pat_angles);
pat = sinc(pat_u/pi);
Specify radar and environment parameters
Set the transmitting frequency to 100 MHz, the free-space range to 100 km, the antenna tilt angle to , and place the antenna 20 meters above the ground. Assume a surface roughness of one meter.
freq = 100e6;
ant_height = 10;
rng_fs = 100;
tilt_ang = 0;
surf_roughness = 1;
Create radar range-height-angle data
Obtain the vertical coverage pattern values and angles for the radar antenna.
[vcp, vcpangles] = radarvcd(freq,rng_fs,ant_height,...
    'RangeUnit','km','HeightUnit','m',...
    'AntennaPattern',pat,...
    'PatternAngles',pat_angles,'TiltAngle',tilt_ang,...
    'SurfaceHeightStandardDeviation',surf_roughness/(2*sqrt(2)));
Plot radar range-height-angle data
Set the maximum plotting range to 300 km and the maximum plotting height to 250,000 m. Choose the range units as kilometers, 'km', and the height units as meters, 'm'. Set the range and height axes scale powers to 1/2.
rmax = 300;
hmax = 250e3;
blakechart(vcp, vcpangles, rmax, hmax, 'RangeUnit','km',...
    'ScalePower',1/2,'HeightUnit','m');
Input Arguments
Name-Value Arguments
Specify optional pairs of arguments as
Name1=Value1,...,NameN=ValueN, where Name is
the argument name and Value is the corresponding value.
Name-value arguments must appear after other arguments, but the order of the
pairs does not matter.
Before R2021a, use commas to separate each name and value, and enclose
Name in quotes.
Example: 'RangeUnit','m'
Height units, specified as one of 'nmi', 'mi',
'km', 'ft', 'm', or
'kft' denoting nautical miles, miles, kilometers, feet, meters,
or kilofeet, respectively. This name-value argument specifies the units for the
maximum height hmax.
Example: 'm'
Data Types: char
Scale power, specified as a scalar in the range [0, 1]. This argument specifies the range and height axis scale power.
Example: 0.5
Data Types: double
Surface refractivity in N-units, specified as a nonnegative real-valued scalar. The surface
refractivity is a parameter of the CRPL Exponential Reference Atmosphere Model used by
blakechart.
Data Types: double
Refraction exponent, specified as a nonnegative real-valued scalar. The refraction exponent is
a parameter of the CRPL Exponential Reference Atmosphere Model used by
blakechart.
Data Types: double
Antenna height, specified as a real-valued scalar. When you provide the antenna
height, the height in the Blake chart is the height above ground level. Otherwise, the
height in the Blake chart is relative to the origin of the ray, and the function
assumes that the antenna is less than 1000 ft (about 305 m) above ground level. Use
the HeightUnit argument to specify the units of
AntennaHeight.
Data Types: double
Face color of vertical coverage pattern patch, specified as a color name, a short
name, a hexadecimal color code, an RGB triplet, or 'none'. If you
specify more than one color, the number of colors must match the number of columns of
vcp.
For a custom color, specify an RGB triplet or a hexadecimal color code.
An RGB triplet is a three-element row vector whose elements specify the intensities of the red, green, and blue components of the color. The intensities must be in the range
[0,1], for example,[0.4 0.6 0.7].A hexadecimal color code is a string scalar or character vector that starts with a hash symbol (
#) followed by three or six hexadecimal digits, which can range from0toF. The values are not case sensitive. Therefore, the color codes"#FF8800","#ff8800","#F80", and"#f80"are equivalent.
Alternatively, you can specify some common colors by name. This table lists the named color options, the equivalent RGB triplets, and the hexadecimal color codes.
| Color Name | Short Name | RGB Triplet | Hexadecimal Color Code | Appearance |
|---|---|---|---|---|
"red" | "r" | [1 0 0] | "#FF0000" |
|
"green" | "g" | [0 1 0] | "#00FF00" |
|
"blue" | "b" | [0 0 1] | "#0000FF" |
|
"cyan"
| "c" | [0 1 1] | "#00FFFF" |
|
"magenta" | "m" | [1 0 1] | "#FF00FF" |
|
"yellow" | "y" | [1 1 0] | "#FFFF00" |
|
"black" | "k" | [0 0 0] | "#000000" |
|
"white" | "w" | [1 1 1] | "#FFFFFF" |
|
"none" | Not applicable | Not applicable | Not applicable | No color |
This table lists the default color palettes for plots in the light and dark themes.
| Palette | Palette Colors |
|---|---|
Before R2025a: Most plots use these colors by default. |
|
|
|
You can get the RGB triplets and hexadecimal color codes for these palettes using the orderedcolors and rgb2hex functions. For example, get the RGB triplets for the "gem" palette and convert them to hexadecimal color codes.
RGB = orderedcolors("gem");
H = rgb2hex(RGB);
Before R2023b: Get the RGB triplets using RGB =
get(groot,"FactoryAxesColorOrder").
Before R2024a: Get the hexadecimal color codes using H =
compose("#%02X%02X%02X",round(RGB*255)).
Example: 'black'
Example: 'k'
Example: [0.850 0.325 0.098]
Example: '#D95319'
Data Types: double | char | string
Edge color of vertical coverage pattern patch, specified as a color name, a short
name, a hexadecimal color code, an RGB triplet, or 'none'. If you
specify more than one color, the number of colors must match the number of columns of
vcp.
For a custom color, specify an RGB triplet or a hexadecimal color code.
An RGB triplet is a three-element row vector whose elements specify the intensities of the red, green, and blue components of the color. The intensities must be in the range
[0,1], for example,[0.4 0.6 0.7].A hexadecimal color code is a string scalar or character vector that starts with a hash symbol (
#) followed by three or six hexadecimal digits, which can range from0toF. The values are not case sensitive. Therefore, the color codes"#FF8800","#ff8800","#F80", and"#f80"are equivalent.
Alternatively, you can specify some common colors by name. This table lists the named color options, the equivalent RGB triplets, and the hexadecimal color codes.
| Color Name | Short Name | RGB Triplet | Hexadecimal Color Code | Appearance |
|---|---|---|---|---|
"red" | "r" | [1 0 0] | "#FF0000" |
|
"green" | "g" | [0 1 0] | "#00FF00" |
|
"blue" | "b" | [0 0 1] | "#0000FF" |
|
"cyan"
| "c" | [0 1 1] | "#00FFFF" |
|
"magenta" | "m" | [1 0 1] | "#FF00FF" |
|
"yellow" | "y" | [1 1 0] | "#FFFF00" |
|
"black" | "k" | [0 0 0] | "#000000" |
|
"white" | "w" | [1 1 1] | "#FFFFFF" |
|
"none" | Not applicable | Not applicable | Not applicable | No color |
This table lists the default color palettes for plots in the light and dark themes.
| Palette | Palette Colors |
|---|---|
Before R2025a: Most plots use these colors by default. |
|
|
|
You can get the RGB triplets and hexadecimal color codes for these palettes using the orderedcolors and rgb2hex functions. For example, get the RGB triplets for the "gem" palette and convert them to hexadecimal color codes.
RGB = orderedcolors("gem");
H = rgb2hex(RGB);
Before R2023b: Get the RGB triplets using RGB =
get(groot,"FactoryAxesColorOrder").
Before R2024a: Get the hexadecimal color codes using H =
compose("#%02X%02X%02X",round(RGB*255)).
Example: 'black'
Example: 'k'
Example: [0.850 0.325 0.098]
Example: '#D95319'
Data Types: double | char | string
Plot axes, specified as an Axes object. If you do not specify the
axes, then the blakechart function creates a range-angle-height
plot in the current axes.
More About
References
[1] Blake, Lamont V. Machine Plotting of Radar Vertical-Plane Coverage Diagrams. Naval Research Laboratory Report 7098, 1970.
[2] Bean, B.R., and G.D. Thayer. "Central Radio Propagation Laboratory Exponential Reference Atmosphere." Journal of Research of the National Bureau of Standards, Section D: Radio Propagation 63D, no. 3 (November 1959): 315. https://doi.org/10.6028/jres.063D.031.
Extended Capabilities
Version History
Introduced in R2021a