Scattering Parameters or S-Parameters
The S-parameters or scattering parameters represent the linear characteristics of radio frequency (RF) printed circuit board (PCB) components. The parameter matrix describes the changes in the reflected and transmitted waves with respect to the incident wave at an N-port PCB component. Using S-parameters you can calculate the gain, loss, phase delay, voltage standing wave ratio (VSWR), and other characteristics of any PCB component or linear network. S-parameters can also be called the behavioral representation of a network.
Basic Concepts
S-parameters are defined in terms of transmission and reflection coefficients. Consider a two-port transmission line. For a two-port device, there are four S-parameters:
Reflected/Input = S11 and S22
Transmitted/Input = S12 and S21
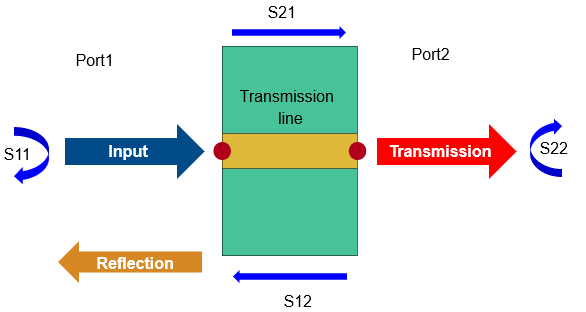
S21 is the measure of the transmitted signal from port 2 relative to the input entering port 1. S11 is the measure of the reflected signal from port 1 relative to the input entering port 1.
For a multiport network, the transmission and reflection coefficients are defined as Snn, Smm, Snm, and Smn, where:
m is the number of input ports.
n is the number of output ports.
Understanding S-Parameter Plots
S-Parameters of Microstrip Transmission Lines
Consider a microstrip transmission line from Transmission Lines. The parameter values for this microstrip transmission line are for a frequency range of 1-5 GHz. Calculate and plot the S-parameters at this frequency range. The operating frequency for the microstrip transmission line is around 2.5 GHz.
mline = microstripLine;
spar = sparameters(mline,linspace(1e9,5e9,50));
rfplot(spar)

Let us look at the S11 and S21 of the plot.
The S11 plot shows the return loss as almost negligible at
-50dB at around 2.3 GHz. As the frequency increases, more signal is reflected back to the input port.The S21 plot describes the end-to-end transmission of the signal. The plot is flat throughout at 0 dB showing very little loss at all frequencies.
S-Parameters of Branchline Coupler
A branchline coupler is a four-Port coupler that has an input port, through port, coupled port, and an isolated port. Port 1 is the input port, port 2 is the through port, port 3 is the isolated port and port 4 is the coupled port. When the couplers are equally split, power is evenly divided between the through port and the coupled port.

Consider the branchline coupler from Splitters and Couplers. The parameter values of this coupler are for a design frequency of 3 GHz. Calculate and plot the S-parameters of this coupler to understand its behavior.
coupler = couplerBranchline;
spar = sparameters(coupler,linspace(1e9,5e9,50));
rfplot(spar,1,1)
hold on
rfplot(spar,2,2)
hold on
rfplot(spar,3,3)
hold on
rfplot(spar,4,4)
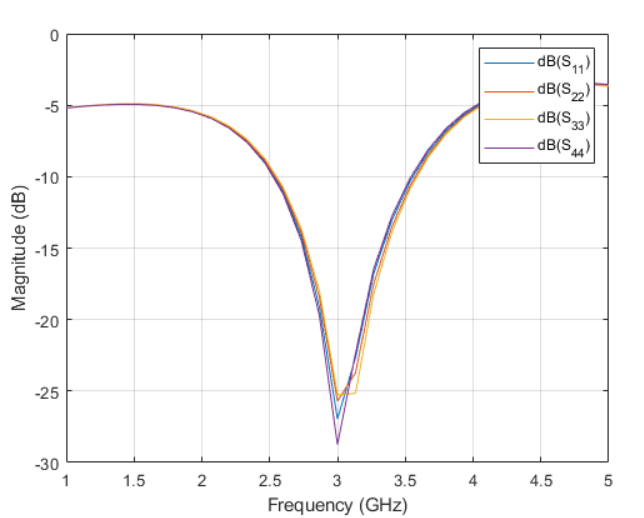
All the reflection coefficients S11, S22, S33, and S44 are close to
-30dB showing that the default branchline coupler has a good match at all ports.rfplot(spar,2,1) hold on rfplot(spar,3,1) hold on rfplot(spar,4,1)

The transmission coefficients of S21 and S41 show that the power is equally divided between Port 2 and Port 4. S31 is
-30dB as Port 3 is isolated.
S-Parameters of Unequal Wilkinson Splitter
An unequal Wilkinson splitter performs arbitrary power division between three ports
based on the power ratio in the component design. 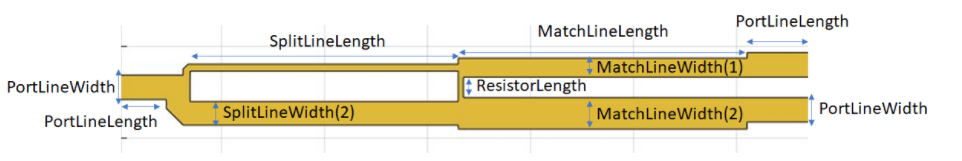
Consider an unequal Wilkinson splitter from Splitters and Couplers. Design it for a frequency of 2.5 GHz and with a power ratio of 4.
splitter = wilkinsonSplitterUnequal;
splitter = design(splitter,2.5e9,'PowerRatio',4);
spar = sparameters(splitter,linspace(1e9,4e9,31));
rfplot(spar,1,1)
hold on
rfplot(spar,2,1)
hold on
rfplot(spar,3,1)
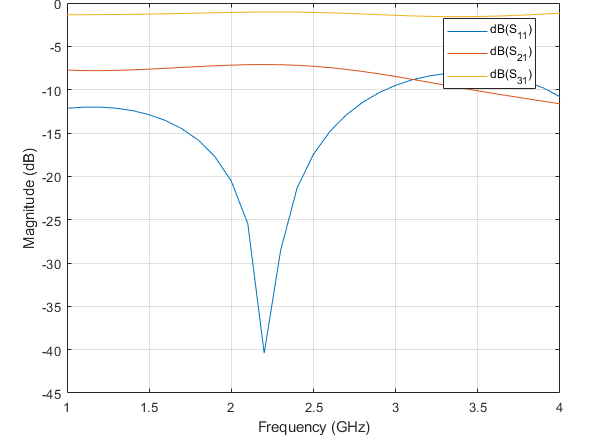
The S11 reflection coefficient shows the value of -
30dB at 2.5 GHz, showing very little reflection at the design frequency.The S31 value is close to
-0.97dB and S21 value is-6.99dB indicating unequal power division at the output ports based on the power ratio of 4.
S-Parameters of Spiral Inductor
A spiral inductor is used as a microwave-resonant element in PCB circuits and as a choke in power supplies.
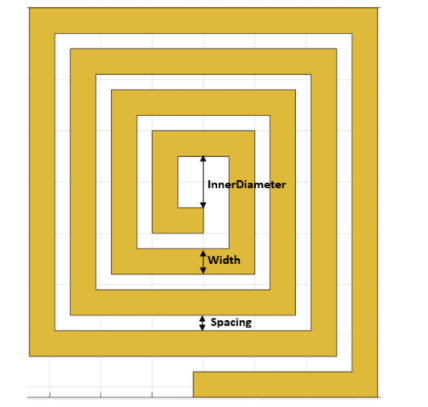
Consider a square spiral inductor from Inductors and Capacitors. Calculate and plot the S-parameters to show the power conservation at the default frequency of 600 MHz.
inductor = spiralInductor;
spar = sparameters(inductor,linspace(200e6,800e6,31));
rfplot(spar);
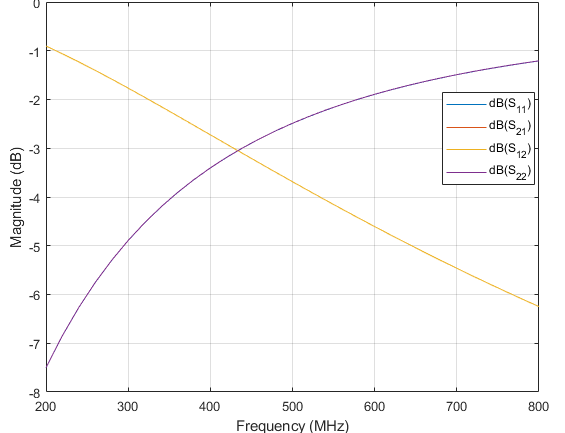
The S11 and S22 values increase to 0 dB after 600 MHz..
The S12 and S21 values decrease indicating that the energy is stored in the inductor and not radiated.
The behavior of the S11 and S21 values satisfies the law of conservation of energy.