主要内容

measuredFilter

R2026b

Extract RF filter circuit model

Since R2024a

    Description

    Use measuredFilter to create an object that accepts a measured s-parameter data file and extracts the Coupling Matrix and other properties of the filter as analysis results.

    Creation

    Syntax

    Description

    mfilter = measuredFilter creates a default extracted filter model object with a filter order of 4.

    example

    mfilter = measuredFilter(PropertyName=Value) sets Properties using one or more name-value arguments. For example, measuredFilter(FilterOrder = 4).

    example

    Properties

    expand all

    2-port s-parameters data specified as a sparameters object. For best results, use input data from a test setup using a calibrated 2-port network analyzer with calibration extended to the test cables. The s-parameter data must include the filter passband response along with sufficient out-of-band rejection for the extraction process to occur.

    Example: sparameters('Filter_6A.s2p')

    Complex Number Support: Yes

    Filter order of the filter under test specified as a real finite positive integer between [1, 14].

    Example: obj = measuredFilter(FilterOrder = 5)

    Data Types: double

    Center frequency of the filter under test, specified as a scalar in Hz.

    Example: obj = measuredFilter(CenterFrequency = 850e6)

    Data Types: double

    Bandwidth of the filter under test, specified as a scalar in Hz. measuredFilter uses a narrow-band approximation algorithm where:

    • The absolute upper fractional bandwidth limit should be set at 30%

    • It is preferred to limit the fractional bandwidth to less than 5%

    Example: obj = measuredFilter(BandWidth = 20e6)

    Data Types: double

    This is a read-only property (analysis result).

    This is a read-only property (analysis result).

    This is a read-only property (analysis result).

    This is a read-only property (analysis result).

    This is a read-only property (analysis result).

    This is a read-only property (analysis result).

    This is a read-only property (analysis result).

    Object Functions

    residueExtract lowpass admittance residues and poles of a measuredFilter object
    transversalMatCalculate the transversal matrix of a measuredFilter object
    canonicalCouplingMatPerform canonical matrix rotation
    optimizeIsospectral optimization of a measuredFilter object
    sparametersCalculate S-parameters for RF PCB objects
    qualityfactorCalculates the unloaded quality factor of a measuredFilter object
    resweepCenter frequency and bandwidth scaling of measured filter

    Examples

    collapse all

    This example shows how to input a measured data file and extract its s-parameters.

    S_measured = sparameters(fullfile(matlabroot,'toolbox','rfpcb', ...
    'rfpcb','rfpcbfilterfiles','FILTER_8.s2p'));
    rfplot(S_measured); hold on
    obj = measuredFilter(...
    Sparameters=S_measured,BandWidth=9.601e6, ...
    CenterFrequency=2114.6528e6,FilterOrder=8);
    S_calc = sparameters(obj);
    rfplot(S_calc,'--')
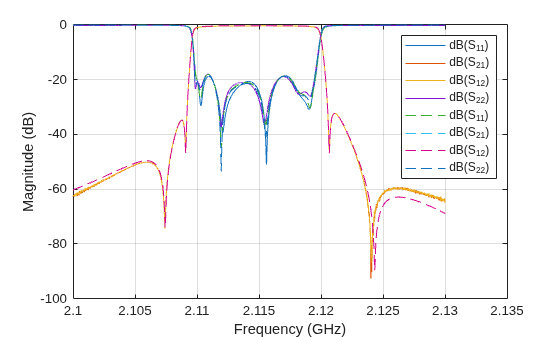
    Figure contains an axes object. The axes object with xlabel Frequency (GHz), ylabel Magnitude (dB) contains 8 objects of type line. These objects represent dB(S_{11}), dB(S_{21}), dB(S_{12}), dB(S_{22}).

    Version History

    Introduced in R2024a