Transmission Line Designer
Description
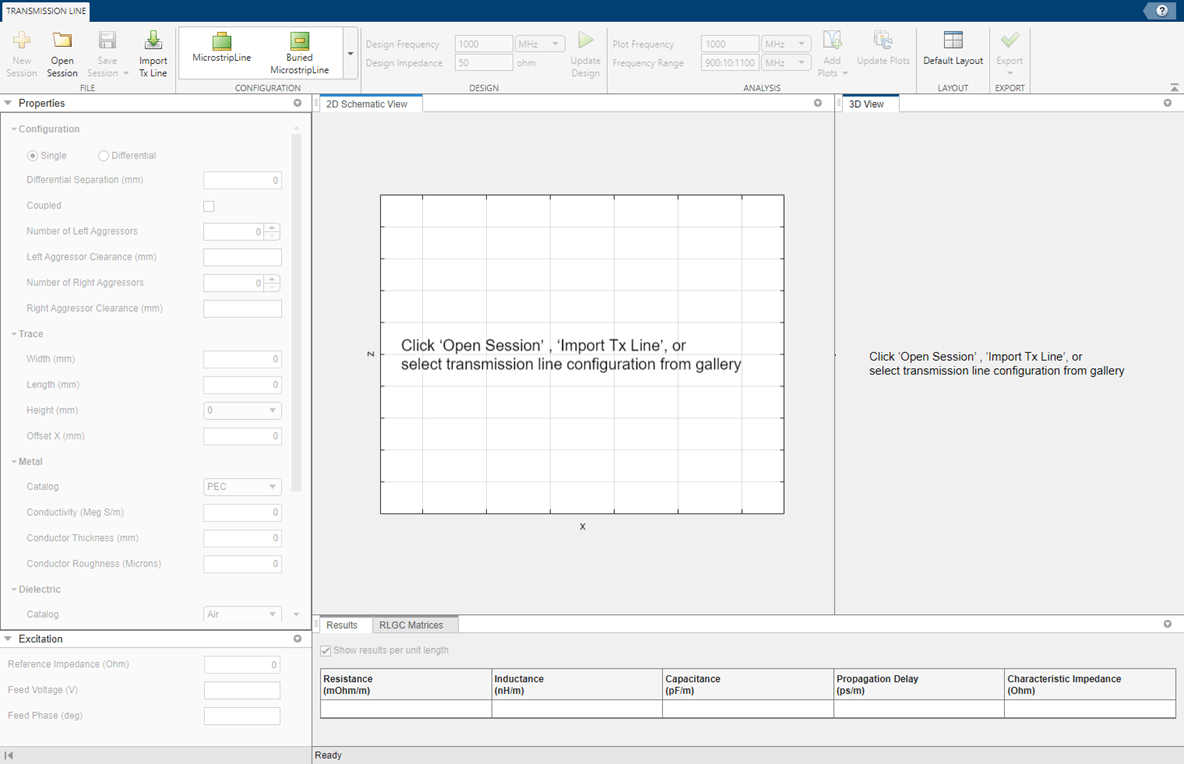
The Transmission Line Designer app lets you design, analyze, and visualize transmission lines.
Using this app you can:
Select transmission line configuration and visualize the geometry.
Design the transmission line for a specified frequency and impedance.
Analyze the transmission line based on RLGC values, propagation delay, S-parameters, current, charge, and layout.
Export selected transmission line variable to MATLAB® workspace.
Export a script for the transmission line design and analysis.
Export S-parameters to a Touchstone file.
Export RLGC values to the MATLAB workspace.
Open the Transmission Line Designer App
MATLAB Toolstrip: On the Apps tab, under Signal Processing and Communications, click the Transmission Line Designer app icon.
MATLAB command prompt: Enter
transmissionLineDesigner.
Examples
Design Microstrip Transmission Line
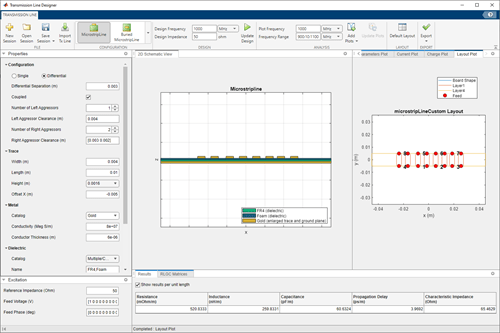
Create a microstrip transmission line using the transmission line designer app.
Launch the Transmission Line Designer app.
transmissionLineDesigner
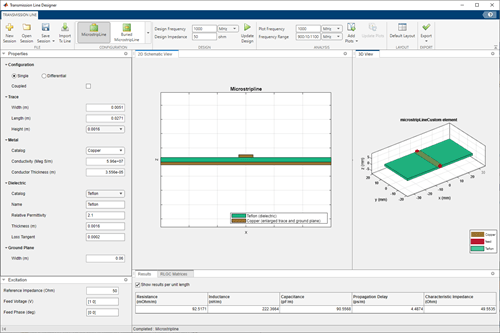
Click Microstrip line in the Configuration section.
Use the Properties pane to add these parameters:
Ground Plane Width = 90mm
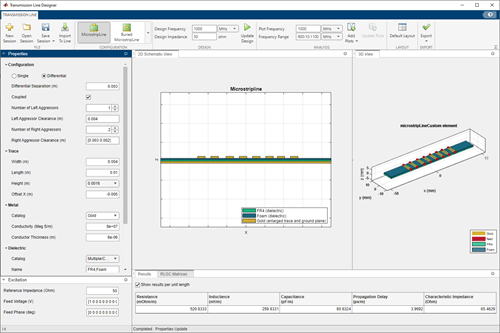
Set
Configurationto Differential.Differential Separation = 3mm
Select Coupled. For the left trace, set Number of Left Aggressors to 1 and Left Aggressor Clearance to 4 mm. For the right trace, set Number of Right Aggressors to 2 and Right Aggressor Clearance to 3 mm and 2 mm.
In the Trace section, set these properties: Width = 4mm, Trace Length = 10mm, Trace X offset = -5mm
In the Metal section, set these properties: Metal = Gold :: Conductivity = 8e+7 ::Thickness = 6e-6m
In
Dielectricsection, under Catalog, select Multiple/Custom. SetNameto FR4,Foam.
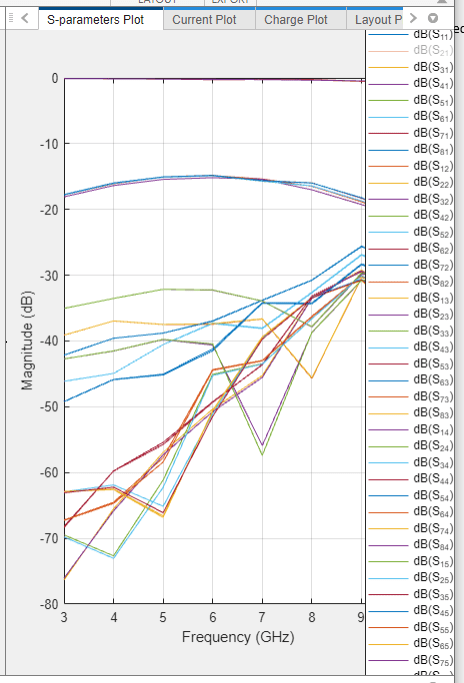
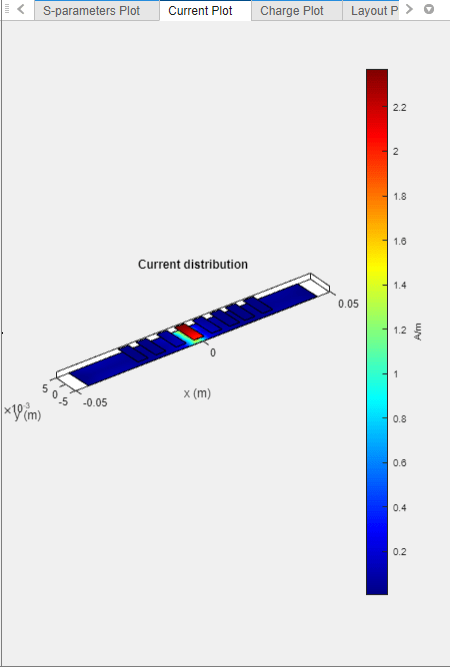
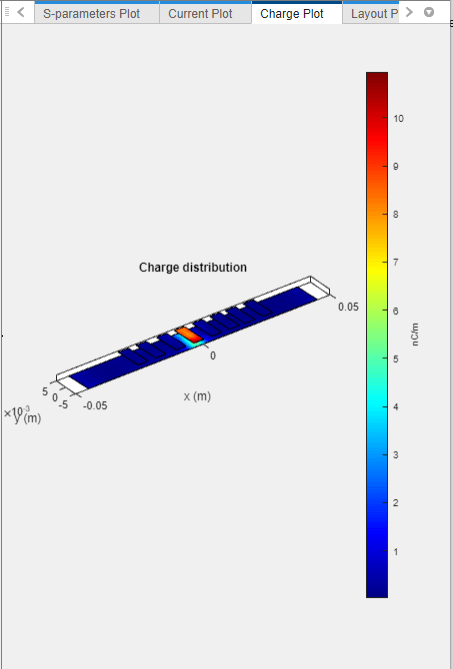
On the app toolstrip, in the Analysis section, click Add Plots to add S-parameters, current, charge, and layout plots.
In the Analysis section, change the Plot Frequency to 5 GHz and the Frequency Range to (3:1:10) GHz. Click Update Plots to update all the plots to the new frequency.
View the S-parameter plot.
View the current plot.
View the charge plot.
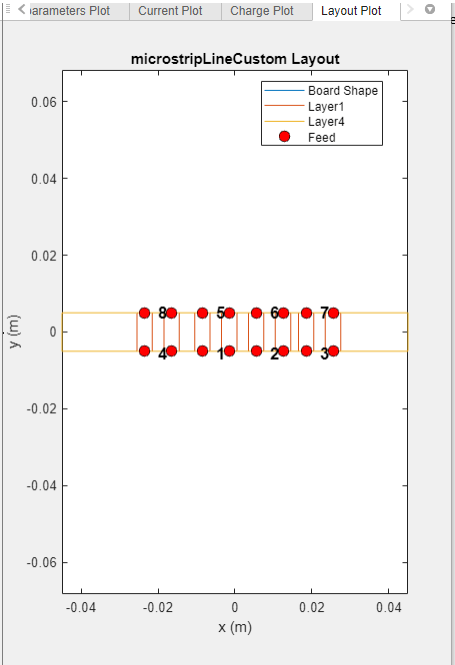
View the layout plot.
Programmatic Use
Version History
Introduced in R2023a
You can also select a web site from the following list:
Americas
- América Latina (Español)
- Canada (English)
- United States (English)
Europe
- Belgium (English)
- Denmark (English)
- Deutschland (Deutsch)
- España (Español)
- Finland (English)
- France (Français)
- Ireland (English)
- Italia (Italiano)
- Luxembourg (English)
- Netherlands (English)
- Norway (English)
- Österreich (Deutsch)
- Portugal (English)
- Sweden (English)
- Switzerland
- United Kingdom (English)