Threshold Predictors
Description
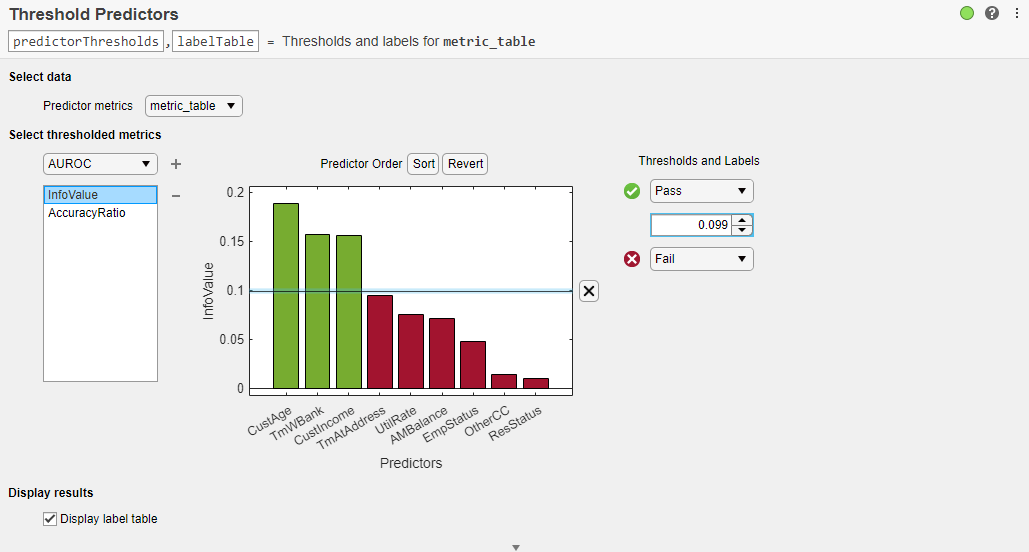
The Threshold Predictors task lets you interactively set credit scorecard predictor thresholds for one or more risk metrics computed for a set of predictors, or features. Risk metric thresholds are part of the feature selection process before building a credit scorecard. The task automatically generates MATLAB® code for your live script.
Using this task, you can:
Select risk metrics from the columns of a table of risk metric data.
Specify thresholds for the risk metrics, separating the rows of predictors into color-coded Pass, Fail, or Undecided regions.
Visualize the labeled and color-coded risk metric values for each thresholded metric.
For general information about Live Editor tasks, see Add Interactive Tasks to a Live Script.
Open the Task
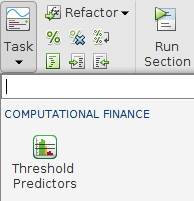
To add the Threshold Predictors task to a live script in the MATLAB Editor:
On the Live Editor tab, select Task > Threshold Predictors.
In a code block in the script, type a relevant keyword, such as
screenpredictors. Select Threshold Predictors from the suggested command completions.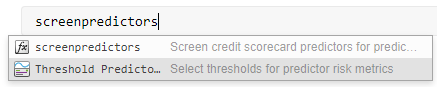
Parameters
The Predictor metrics table must be a numeric MATLAB table. The columns of the Predictor metrics table contain the values for a particular risk metric (for example, information value or accuracy ratio) for a set of model predictors. The rows of the table contain the values of each risk metric for a particular predictor. The Predictor metrics table must have defined row names.
Typically, you create the Predictor metrics table
using the screenpredictors function. screenpredictors takes a creditscorecard input
data set and calculates the risk metrics table.
Example: metric_table =
screenpredictors(data,'IDVar',idvar,'ResponseVar',responsevar)
The Select thresholded metrics list shows which metrics have thresholds specified. The Select thresholded metrics drop-down box contains the risk metrics defined in the columns of the Predictor metrics table.
To specify a threshold:
Select a risk metric from the Select thresholded metrics drop-down box and click the plus
 button. The metric is added to the
Select thresholded metrics list box
and the Predictors plot displays with a
default threshold and region labels.
button. The metric is added to the
Select thresholded metrics list box
and the Predictors plot displays with a
default threshold and region labels.To adjust a threshold, drag the associated threshold line or use the Thresholds and Labels spinner controls.
Set additional thresholds by clicking the Predictors plot at the desired value.
Select a different metric from the Select thresholded metrics list box. The Predictors plot updates to show the associated metric bar chart with its overlaid threshold lines.
To remove a threshold:
Select the threshold line or the associated Thresholds and Labels spinner and click the line delete
 button on the
Predictors plot. You can remove
all thresholds for
the selected risk metric by clicking the minus
button on the
Predictors plot. You can remove
all thresholds for
the selected risk metric by clicking the minus  button next to the Select
thresholded metrics list box.
button next to the Select
thresholded metrics list box.
When using a Predictor metrics table that is
created using the screenpredictors function, you can set thresholds for
any of the following metrics:
InfoValue
Entropy
Accuracy Ratio
AUROC
Gini
Chi2PValue
PercentMissing
For more information on the metrics for screenpredictors, see metric_table.
The Thresholds and Labels controls are composed of spinners for each specified threshold of the currently selected risk metric and drop-down boxes that set the labels for the surrounding regions to Pass, Fail, or Undecided.
The Thresholds and Labels spinners are sorted in descending order from top to bottom. The region labels can be set to Pass, Fail, or Undecided where the region label defines the label for all metric values that lie on a particular side of a threshold.
Check the Display label table check box to display the current set of labeled metric values. The label table contains the columns from the Predictor metrics table for which there are specified thresholds. The entries in the label table are categorical labels (Pass, Fail, or Undecided) based on which region each metric value is found.
Tips
To sort the predictors in the Predictors plot, click Sort.To revert to the original sort order, click Revert.
Each time you add a new threshold by clicking the Predictors plot, a new set of controls is added to the Thresholds and Labels section. Use the spinner to fine tune the threshold value. Use the label drop-down box to set the appropriate label (Pass, Fail, or Undecided) for the newly defined region of metric values.