Visualize Messages from Live ROS or ROS 2 Topics
Connect to Source ROS or ROS 2 Network
To connect the ROS Data Analyzer app to a live ROS or ROS 2 network, use the Open > Live Network Data option from the app toolstrip.
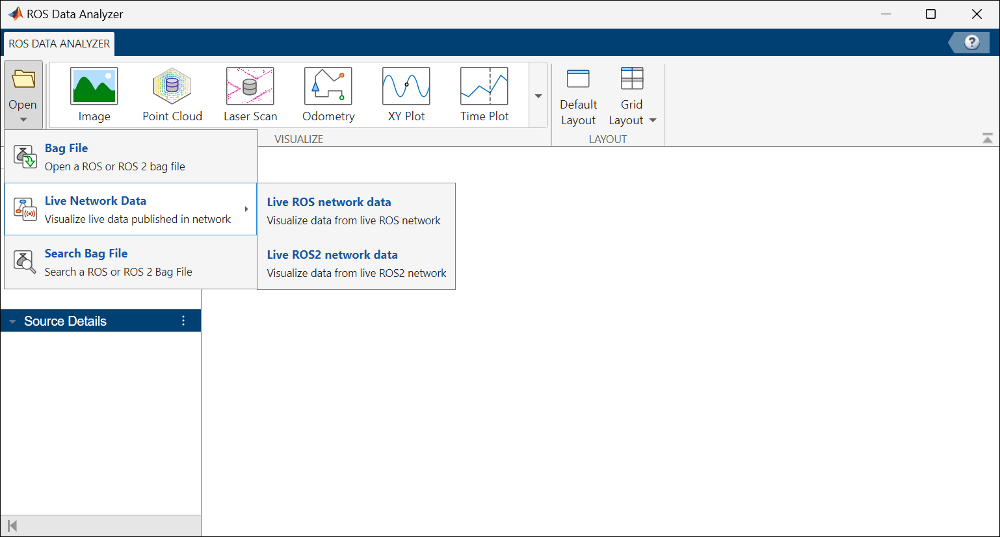
To visualize topics in a live ROS network, provide the ROS Master
URI in the Enter Network Details dialog box after
clicking Live ROS network data. The default ROS
Master URI is set to http://localhost:11311. You can
also choose from the latest 10 ROS Master URI entries stored in the
dropdown.
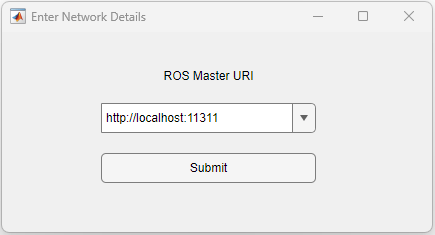
To visualize topics in a live ROS 2 network, provide the ROS Domain
ID. The default ROS Domain ID is set to
0. You can also choose from the latest 10 ROS Domain
ID entries stored in the dropdown, similar to ROS Master
URI.
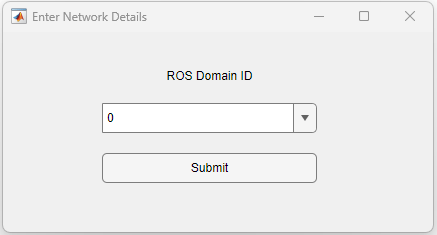
The toolstrip also contains the list of supported visualizers under the Visualize tab, and allows you to choose the layout between Default and Grid.
View Live Network Details
The details of live network are found on the left side under the app toolstrip.
Upon accessing a live network for visualization, the toolstrip automatically configures itself, displaying the Start
 icon.
icon.The Topic List shows the available topics in the ROS or ROS 2 live network. Click Refresh to update the Topic List with latest topics added to the opened live network.
The Source Details lists the ROS Master URI if you have opened a live ROS network. In case of a live ROS 2 network, it shows the ROS Domain ID.
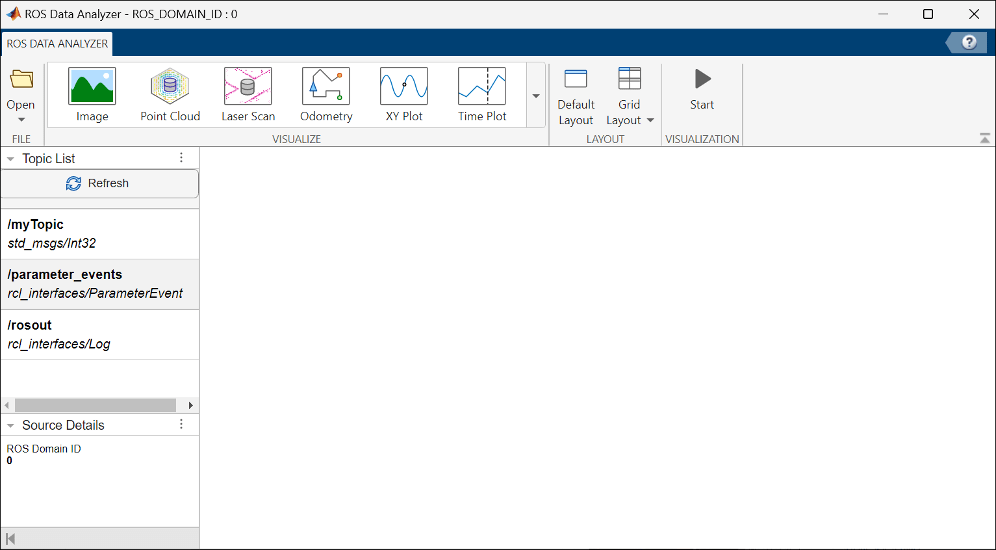
Create Visualizers for Topics
You can configure the grid layout from the Layout tab and choose
one or multiple viewers to visualize the messages in a topic. Choose the data source
that you want to visualize from the dropdown of the selected viewer and click
Start
![]() icon from the toolstrip to commence the visualization
of the live network topic. Upon initiating the visualization, the
Start icon transitions to a Stop icon
icon from the toolstrip to commence the visualization
of the live network topic. Upon initiating the visualization, the
Start icon transitions to a Stop icon ![]() which enables you to halt the visualization at any
specific instant.
which enables you to halt the visualization at any
specific instant.
Types of Viewer
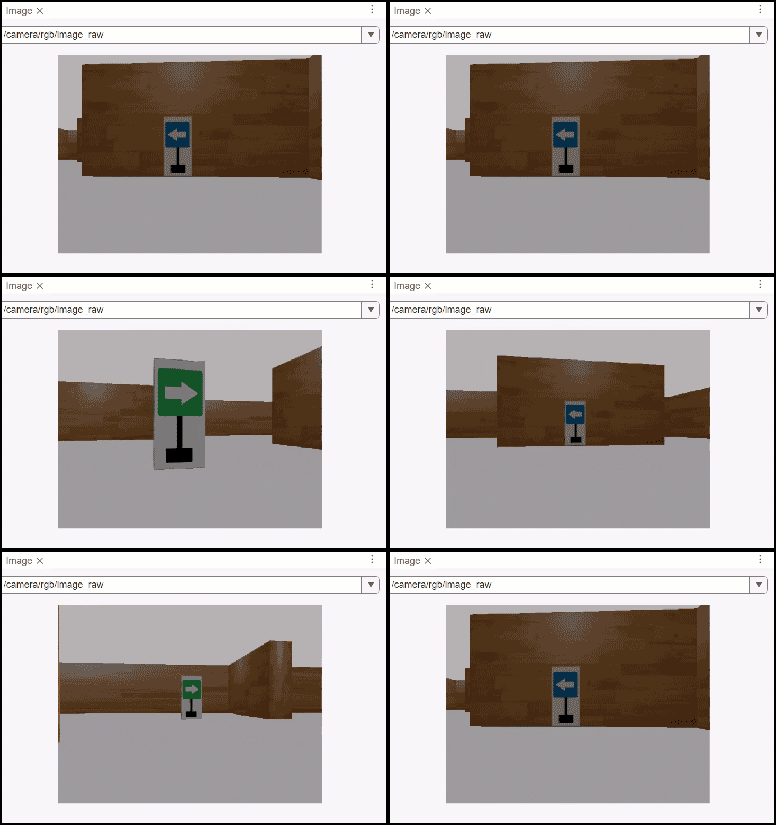
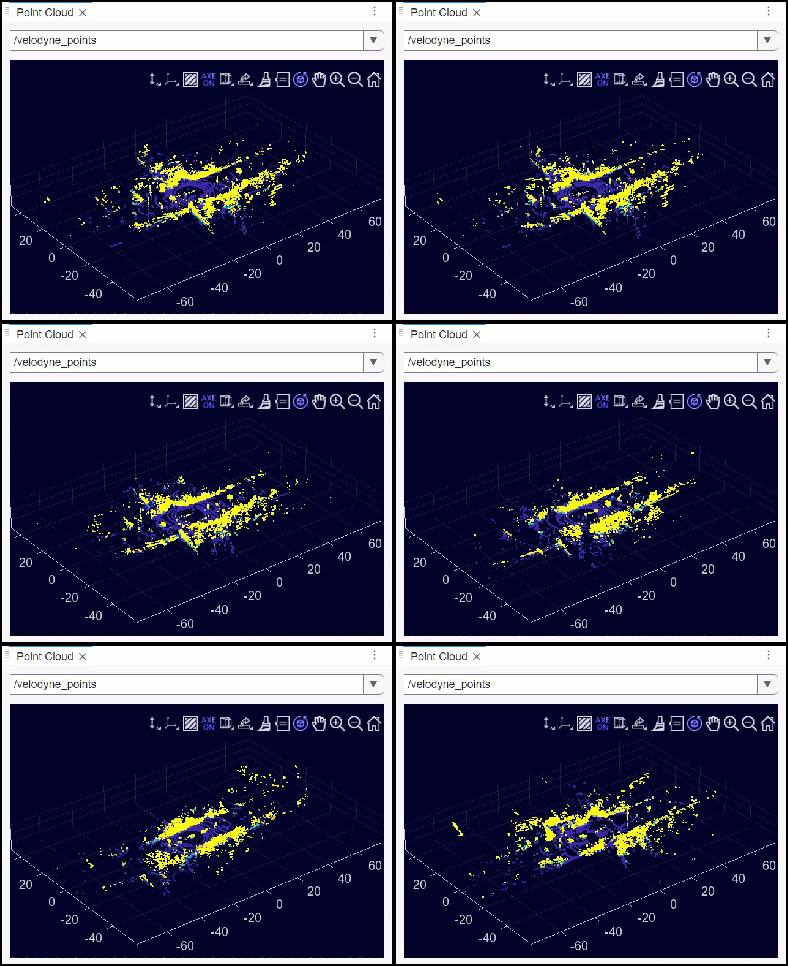
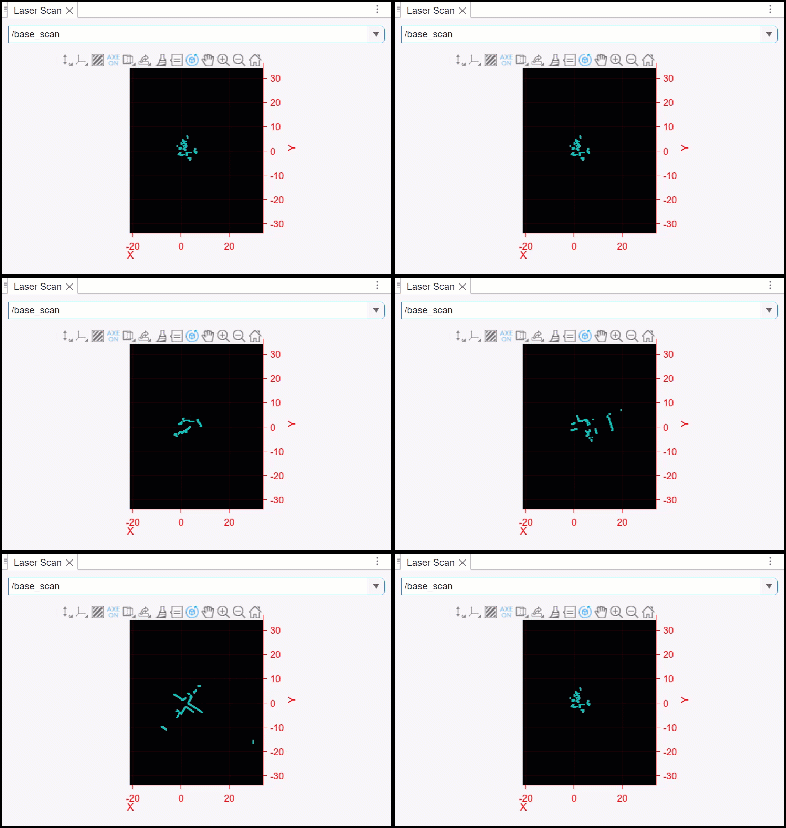
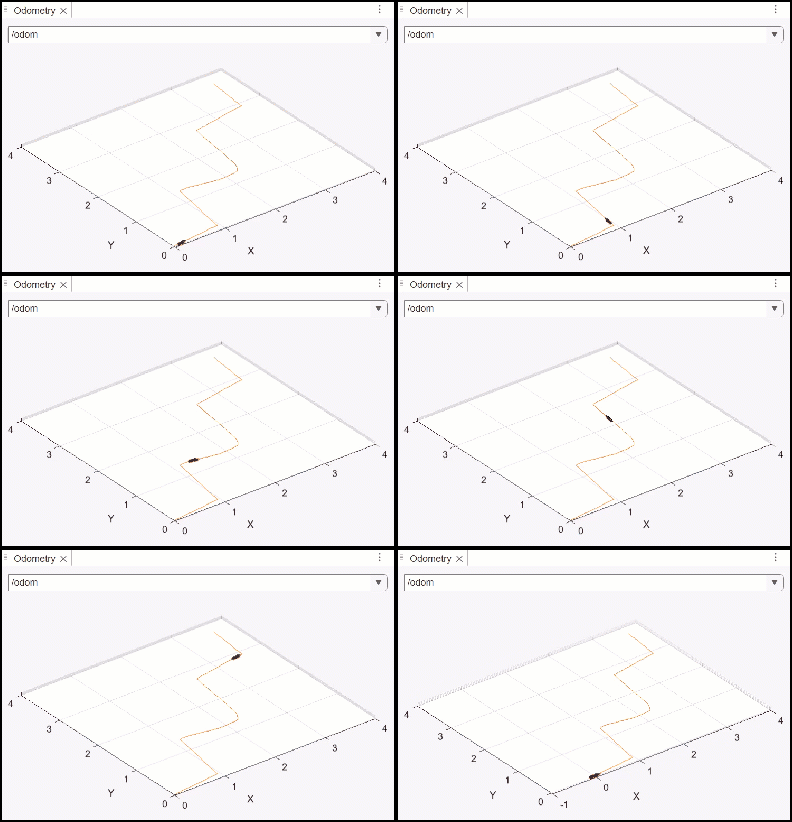
| Viewer | Viewer Icon | Interface | Description |
|---|---|---|---|
| Image Viewer |
|
|
|
| Point Cloud Viewer |
|
|
|
| Laser Scan Viewer |
|
|
|
| Odometry Viewer |
|
|
|
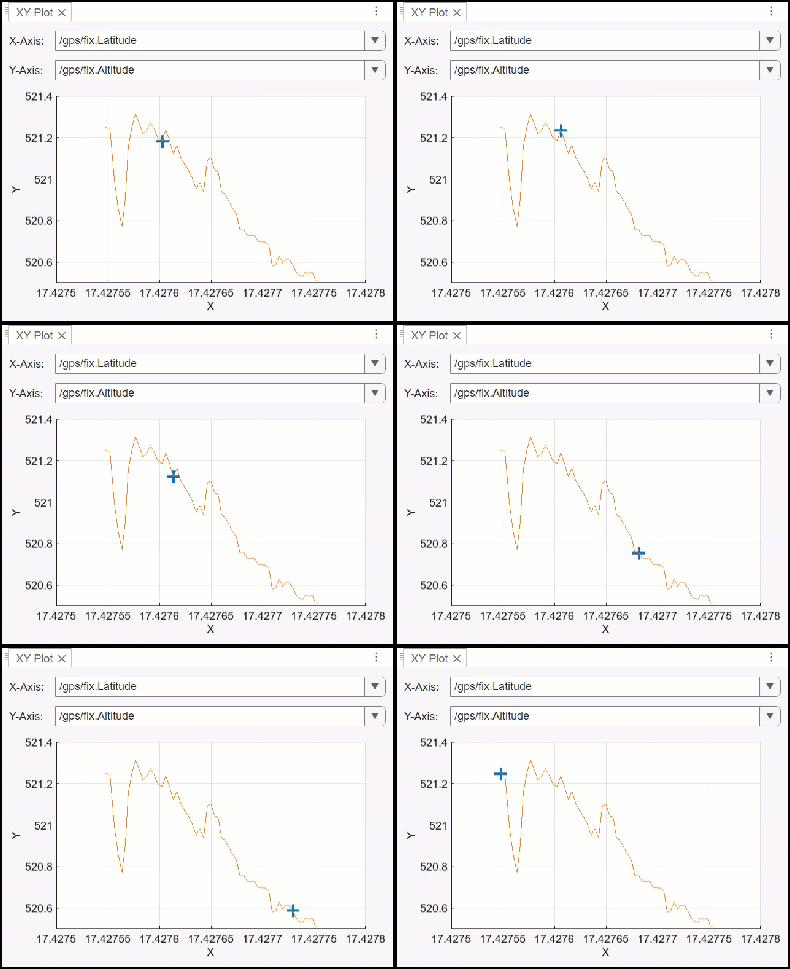
| XY Plot Viewer |
|
|
|
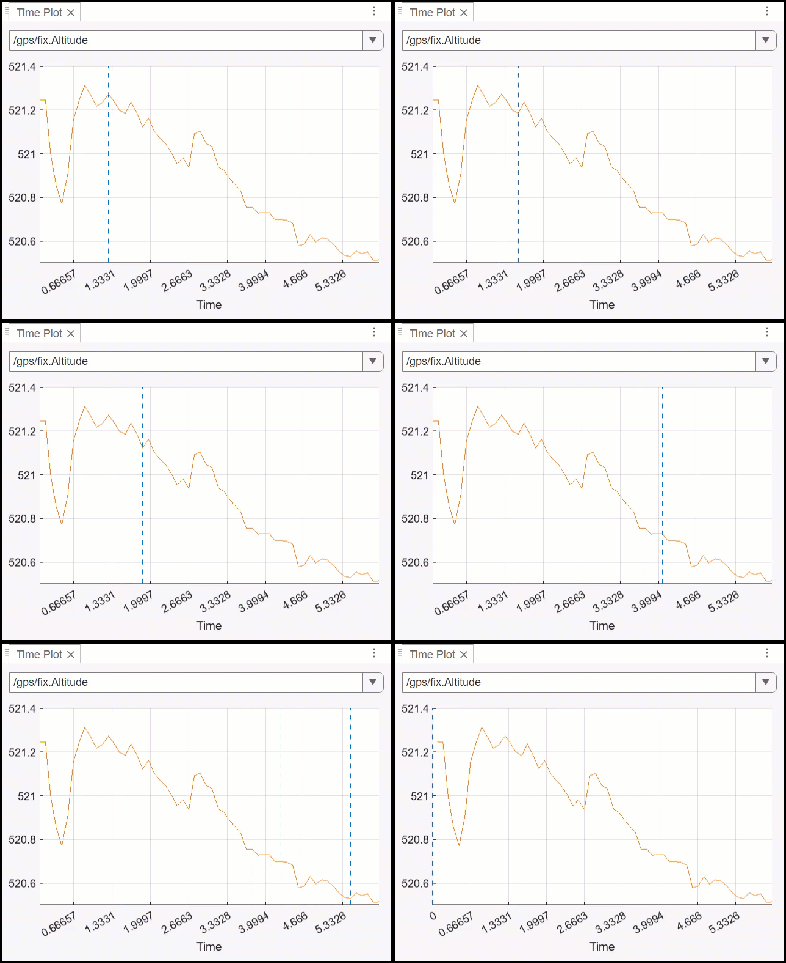
| Time Plot Viewer |
|
|
|
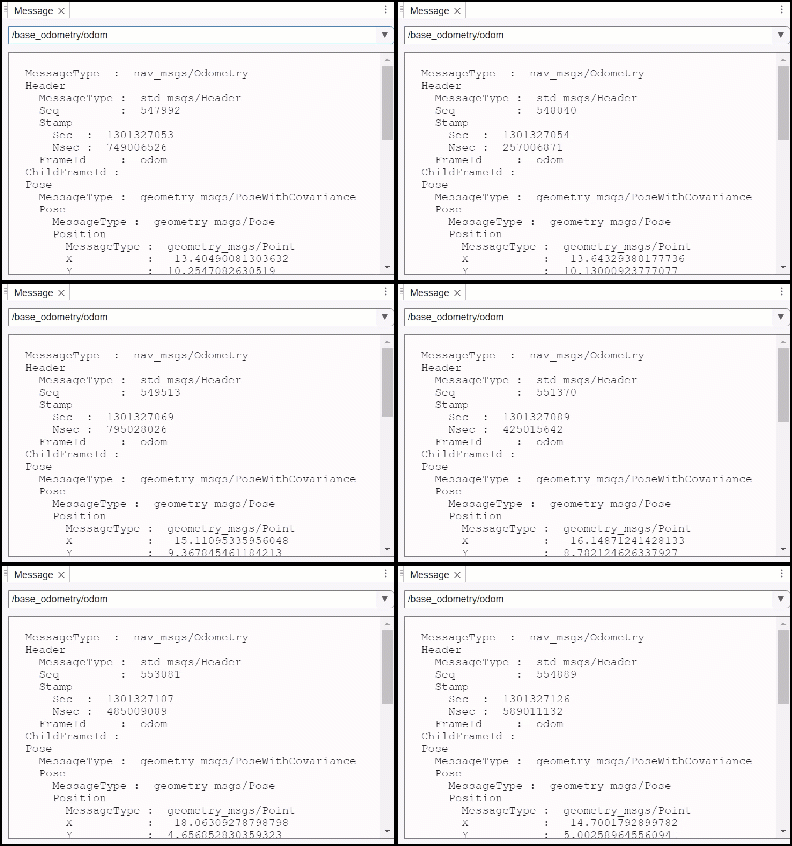
| Message Viewer |
|
|
|
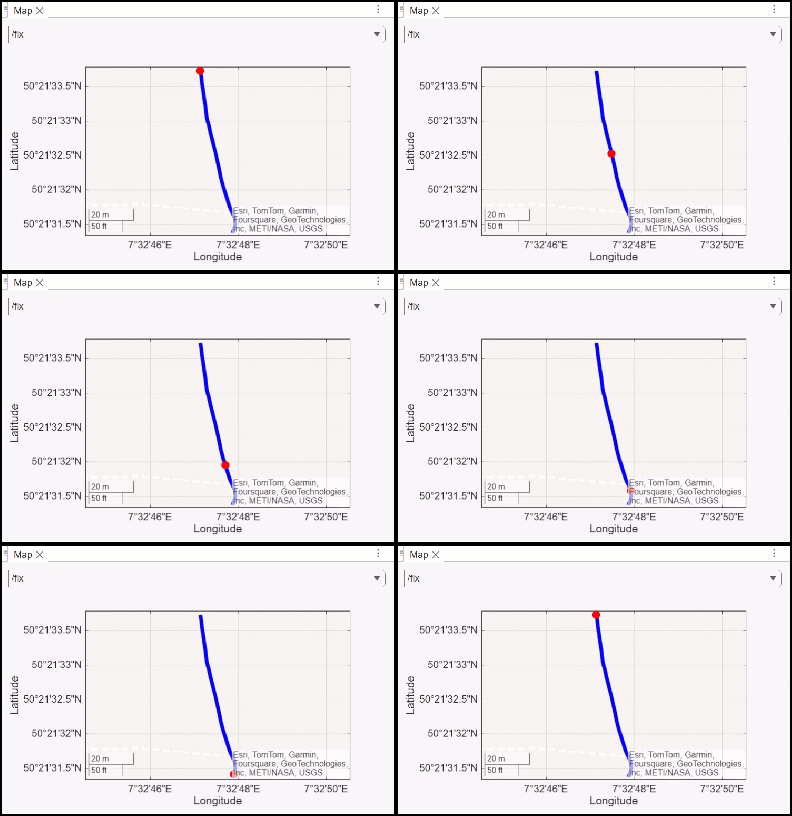
| Map Viewer |
|
|
|
| 3D Viewer |
|
|
|
| Marker Viewer |
|
|
|
Example
Visualize Messages from Topic in Live ROS 2 Network
This example shows how to create a ROS 2 node, publish messages to a topic in that node and visualize those messages live in the ROS Data Analyzer app.
Create a ROS 2 node in the network specified by the default Domain ID 0.
node = ros2node("myNode")node =
ros2node with properties:
Name: '/myNode'
ID: 0
Create a ROS 2 publisher object to publish messages on a topic of the message type std_msgs/Int32. Add the topic to the network topic list.
pub = ros2publisher(node,"myTopic","std_msgs/Int32")
pub =
  ros2publisher with properties:

        TopicName: '/myTopic'
      MessageType: 'std_msgs/Int32'
          History: 'keeplast'
            Depth: 10
      Reliability: 'reliable'
       Durability: 'volatile'
         Deadline: Inf
         Lifespan: Inf
       Liveliness: 'automatic'
    LeaseDuration: Inf
You can now see the list of topic names in the publisher pub registered in the ROS 2 network.
ros2 topic list
/myTopic
/parameter_events
/rosout
Create an empty message determined by the topics published by the ROS 2 publisher pub.
msg = ros2message(pub)
msg = struct with fields:
    MessageType: 'std_msgs/Int32'
           data: 0
Create for loop to change the message being published to pub every second with an increment of 1.
for ctr=1:1000
    msg.data=int32(ctr);
    pub.send(msg)
    pause(1)
end
Open ROS Data Analyzer using this command in the Command Window. You can also open the app from the Apps tab in MATLAB® toolstrip.
rosDataAnalyzer
Open the live ROS 2 Network from the app toolstrip and you can verify the topics present in this live network under Topic List.
Select the Message Viewer from the Visualize tab and select the data source /myTopic from the dropdown of the viewer. Click the Start icon from the Visualization tab in the toolstrip to visualize the messages in this live network. You can stop the visualization at any specific time by clicking the Stop icon.

