Add Figures to Report Based on Creation Order
This example shows how to add figures to a report in the order of their creation. You can use the Report Explorer or the Report API to create the report, generate the figures, and append them to the report.
Use the Report Explorer
To use the Report Explorer to append figures to a report in the order of their creation, you specify the components that generate the figures, capture a snapshot of each figure, and append the snapshot to the report. Open the figure_order_ex.rpt file in the Report Explorer.
setedit("figure_order_ex.rpt")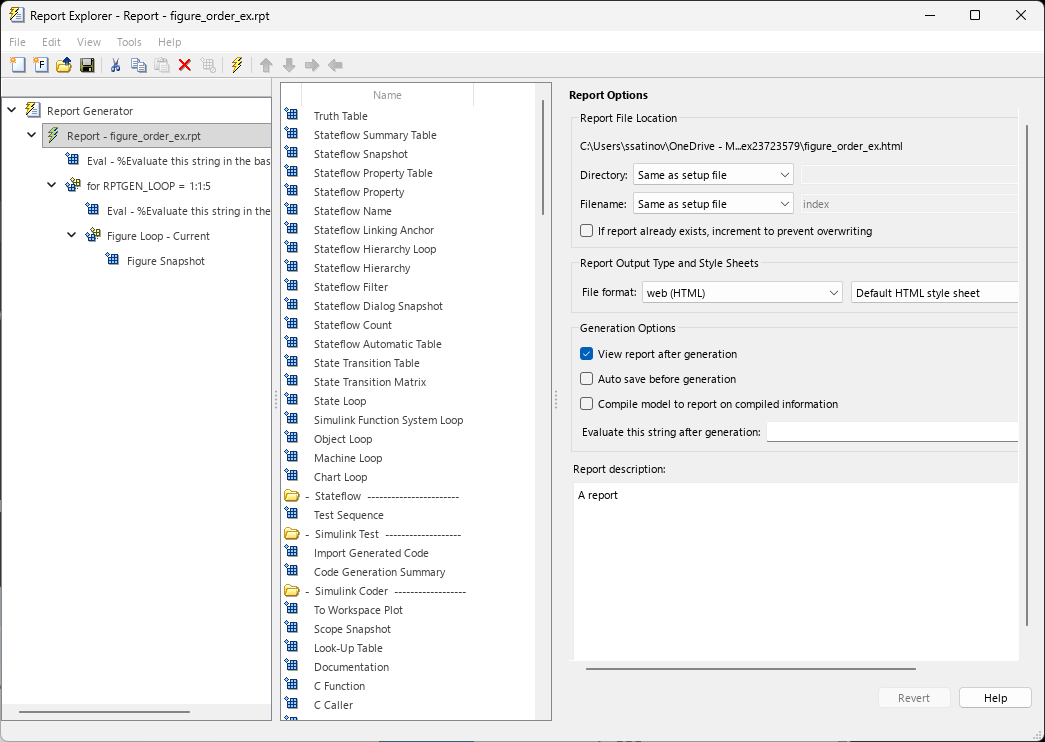
To generate the figures, the report uses an Evaluate MATLAB Expression component. When you generate the report, the component creates five figures. The Eval node under the Report node contains this code:
for i = 1:5
   figure(i)
   plot(rand(1,100));
   title(num2str(i))
end
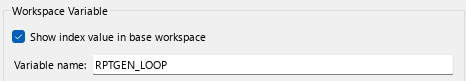
After generating the figures, the report captures the figures. To do this, the report executes uses a For Loop component that loops over the number of figures. In the Report Explorer, the For Loop component evaluates each of the subcomponents for each value of an incrementing variable. Click the component labeled RPTGEN_LOOP = 1:1:5. The component creates a loop variable named RPTGEN_LOOP.
For each value of the loop variable, the For Loop component executes an Evaluate MATLAB Expression component that selects the figure. To see the code that executes, click Report > for RPTGEN_LOOP = 1:1:15 > Eval in the left pane:
figure(RPTGEN_LOOP)
Because the figure array indexes the figures based on when you create them, the loop selects the earliest figure first, and the latest last.
To operate on the selected figure, the For Loop component uses a Figure Loop subcomponent where the Include figures property is set to Current figure only. The Figure Loop component then executes a Figure Snapshot component that takes a snapshot of the figure and appends it to the report.
The report repeats this process for each snapshot. To generate the report, click File > Report.
Use the Report API
To use the API to append figures to a report in the order of their creation, you create a report, generate the figures and store them in an array, capture each figure in a mlreportgen.report.Figure object, and append each object to the report.
First, create an html report.
rpt = mlreportgen.report.Report("myReport","html");
Then, generate the figures and store them in a graphics object array. Because the for-loop adds the figures to the array as it creates them, the index of the array elements represent the order of their creation.
myFigures = gobjects(5,1);
for i = 1:numel(myFigures)
    myFigures(i) = figure(i);
    myFigures(i).Visible = "off";
    plot(rand(1,100));
    title(num2str(i));
end
Finally, create mlreportgen.report.Figure objects for each figure, and append the figures to the report based on their index.
for i = 1:numel(myFigures)
    reportFig = mlreportgen.report.Figure(myFigures(i));
    append(rpt,reportFig);
end

close(rpt)
See Also
setedit | mlreportgen.report.Figure