mlreportgen.report.Figure 类
命名空间: mlreportgen.report
超类: mlreportgen.report.Reporter
图窗报告器
描述
创建一个带有标题、图窗和题注的图窗报告器。
mlreportgen.report.Figure 类是一个 handle 类。
创建对象
描述
fig = mlreportgen.report.Figure 创建了一个报告器,对 MATLAB® 中当前打开的图窗进行快照并将其添加到报告中。使用图窗属性添加题注或更改图窗大小。快照图像存储在报告的临时文件夹中。当报告关闭时,快照图像将被复制到报告中,并且图像将从临时文件夹中删除。为了防止快照图像文件被删除,请使用报告的 Debug 属性。请参阅 mlreportgen.report.Report。
fig = mlreportgen.report.Figure(source) 创建一个报告器,添加 source 指定的图窗,并将 Source 属性设置为 source。
fig = mlreportgen.report.Figure(Name=Value) 使用名称-值参量设置属性。您可以按任意顺序指定多个名称-值参量。
属性
方法
示例
在报告中添加表面图的图窗并设置图窗题注和高度。
import mlreportgen.report.*
surf(peaks);
rpt = Report('peaks');
chapter = Chapter();
chapter.Title = 'Figure Example';
add(rpt,chapter);

fig = Figure();
fig.Snapshot.Caption = '3-D shaded surface plot';
fig.Snapshot.Height = '5in';

add(rpt,fig);
delete(gcf);
rptview(rpt);
在报告中添加两个数字。要将它们在页面上彼此相邻放置,请使用 DOM 表对象。
import mlreportgen.report.*
import mlreportgen.dom.*
rpt = Report('peaks');

surf(peaks(20));
figure = Figure();
peaks20 = Image(getSnapshotImage(figure,rpt));
peaks20.Width = '3in';
peaks20.Height = [];
delete(gcf);

surf(peaks(40));
figure = Figure();
peaks40 = Image(getSnapshotImage(figure,rpt));
peaks40.Width = '3in';
peaks40.Height = [];
delete(gcf);

t = Table({peaks20,peaks40;'peaks(20)','peaks(40)'});
add(rpt,t);
close(rpt);
rptview(rpt);
此示例生成一个 PDF 报告,说明了使用 print 命令调整图窗快照图像大小与使用 Snapshot 报告器的 Figure 属性指定的报告器调整大小之间的区别。
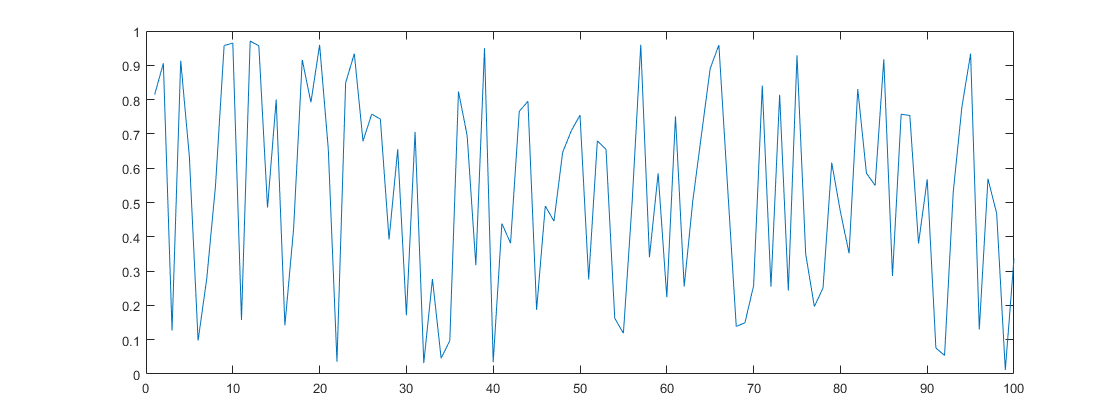
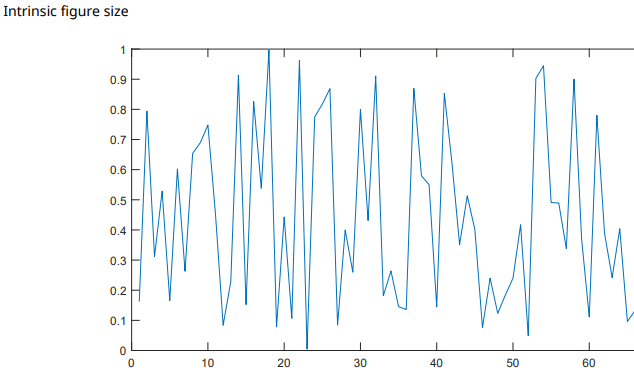
创建一个较宽的 MATLAB® 图
窗。从图中创建三个 mlreportgen.report.Figure 报告器并将其添加到报告中。
第一个
Figure报告器没有调整图窗大小。第二个
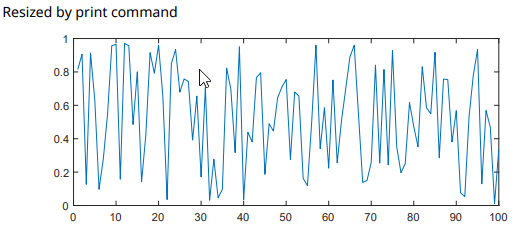
Figure报告器使用print命令来调整图窗大小。第三个
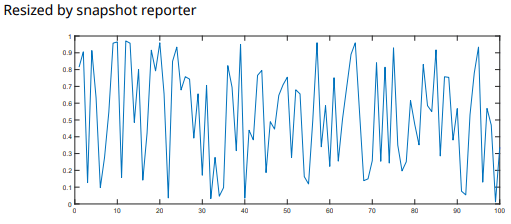
Figure报告器使用Snapshot报告器来调整图窗大小。
import mlreportgen.report.*

fig = figure();
ax = axes(fig);
plot(ax, rand(1,100));

pos = fig.Position;
fig.Position = [pos(1) pos(2) 2*pos(3) pos(4)];

rpt = Report('example','pdf');

add(rpt, "Intrinsic figure size");
figReporter0 = Figure(fig);
figReporter0.Scaling = 'none';
add(rpt,figReporter0);

add(rpt, "Resized by print command");
figReporter1 = Figure(fig);
add(rpt,figReporter1);

add(rpt, "Resized by snapshot reporter");
figReporter2 = Figure(fig);
figReporter2.Scaling = 'none';
figReporter2.Snapshot.ScaleToFit = true;
add(rpt,figReporter2);
close(rpt);
delete(fig)
rptview(rpt);
以下是生成的报告中的数字:
限制
在没有监视器的服务器上生成报告时,
Figure报告器无法拍摄快照。
提示
报告生成器根据 Scaling 属性的值计算图窗快照的宽度和高度。图例是浮动元素,与坐标区或图窗内容没有紧密绑定。当使用
Scaling值调整图窗的尺寸时,报告中的图例位置可能会与图窗中的位置发生偏移。