记录并可视化数据
此示例展示了如何记录变量并与结果进行交互以可视化数据。您可以使用不同的 MATLAB® 和 Simulink® 工具来可视化您生成的仿真数据并与之交互。
要打开模型,请输入:
openExample('sdl/SimpleGearExample')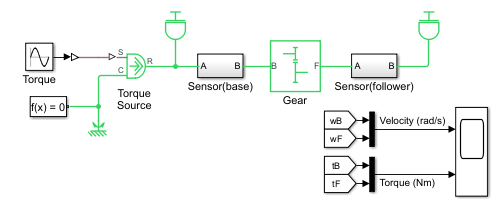
通过记录数据,可以捕获和存储仿真结果以供将来使用。记录数据后,您可以对其进行分析,以了解系统行为,验证模型或优化系统性能。
使用 Scope 模块进行可视化
模型中包含 Sensor(base) 和 Sensor(follower) Subsystem 模块。子系统内包含传感器模块,用于跟踪网络中的物理属性。Scope 模块显示来自这些子系统的 Simulink 信号。您可以使用 PS-Simulink Converter 模块将来自 Simscape 传感器模块的物理信号输出到 Scope 模块。此模型使用 Motion Sensor 模块和 Torque Sensor 模块将物理信号数据输出到 Scope 模块。
运行模型并打开 Scope 模块以查看输出。
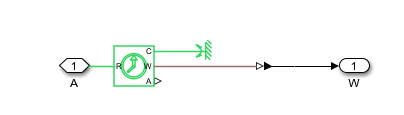
您还可以使用 Probe 模块来选择模块变量并将这些变量输出到 Scope 模块。例如,您可以将 Probe 模块绑定到模型中的 Simple Gear 模块,并将基端速度变量 B.w 和从端速度变量 t.B 输出到 Scope 模块。
记录并可视化选定模块变量
通过使用 Simscape 选择性记录,您可以选择要记录的单个模块变量。您可以使用数据检查器工具显示记录的数据。
要记录 Simple Gear 模块 Gear 和 Inertia 模块 Inertia2 中的选定模块变量,请执行以下操作:
选择
Gear模块。在 Simscape 模块选项卡中,点击插桩表。
在模型数据编辑器窗格中,为
Gear模块选择B.w和tB变量。然后为Inertia2模块选择w和t变量。
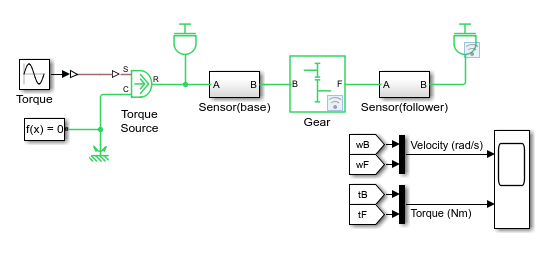
选择性记录使用 Simulink 数据记录。Simscape™ 模块上的灰色记录徽章表示 Simulink 数据记录已禁用。要启用 Simulink 记录,请首先在建模选项卡中点击模型设置,以打开“配置参数”对话框。然后,在数据导入/导出部分中,选择信号记录。确认两个模块上的记录徽章都变为蓝色。
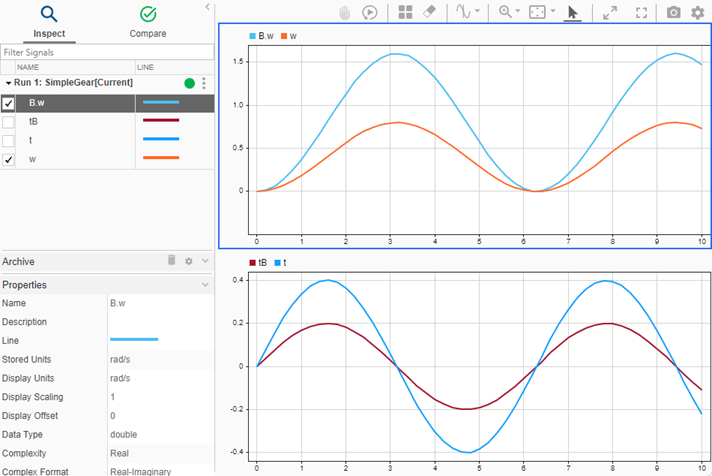
要查看结果,请运行模型,然后在仿真选项卡下,点击数据检查器。
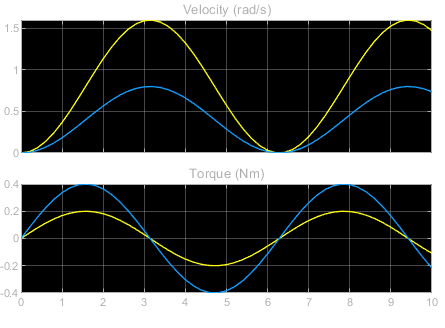
在 SimpleGear 下选择 B.w 和 w,它们分别是 Simple Gear 模块的基端速度和从端速度。您可以使用可视化和布局按钮  在第一个绘图窗口下方添加第二个绘图窗口。突出显示下方的绘图窗口,并在
 SimpleGear 下选择 tB 和 t,它们分别是 Simple Gear 模块的基端扭矩值和从端扭矩值。这些信号与 Scope 模块的结果一致。
记录并可视化所有模型数据
Simscape 数据记录会记录模型或选定模块中的所有模块变量。要启用 Simscape 数据记录,请在“配置参数”对话框的 Simscape 部分中选择信号记录。要了解有关 Simscape 数据记录的详细信息,请参阅记录、导航和绘制仿真数据。
数据会保存到工作区变量中,您可以在 Simscape 结果浏览器中查看结果。要查看结果,请在仿真选项卡下点击 Simscape 结果浏览器按钮。您可以选择模型中的任何模块变量。
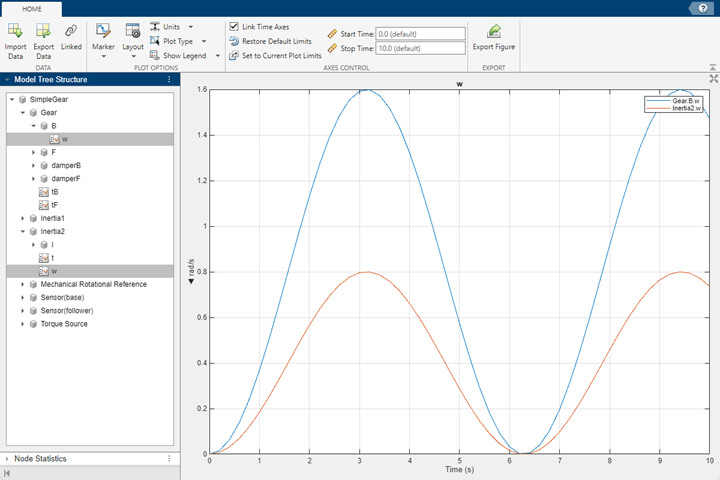
图中显示了 Simscape 结果浏览器工具界面,该界面中显示了 Simple Gear 模块的基端速度和从端速度。但是,模型中每个 Simscape 模块的所有变量数据都可以在该工具中找到。