Dashboard
使用 Dashboard 模块创建交互式仪表板面板并将其部署到 Arduino® 板。在 LCD 显示屏或 Android® 设备上查看面板。
模型设置
精选示例
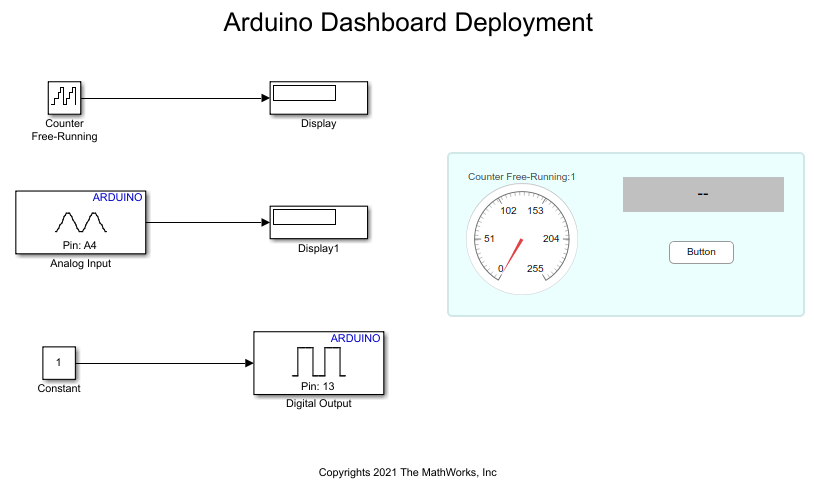
Create and Deploy Interactive Dashboard on Arduino
Use the Simulink® Support Package for Arduino® Hardware to create and deploy an interactive dashboard panel using the Push Button, Circular Gauge, and Display blocks on your Arduino hardware. You can interface any graphical TFT or LCD display type with your Arduino hardware to view the dashboard. This example uses the Adafruit ILI 9341 graphical LCD display.

Develop Multi-Sensor Dashboard Using Arduino
Measure equivalent carbon dioxide (eCO2) concentration levels and equivalent total volatile organic compound (eTVOC) concentration levels using the CCS811 Air Quality Sensor block from the Simulink® Support Package for Arduino® Hardware. The model notifies you when the eCO2 and eTVOC levels cross the acceptable thresholds through an alarm lamp on the dashboard. You can publish the eCO2 and eTVOC concentration levels on a ThingSpeak™ channel. You can also display the sensor data on an Android® application using dashboard display. In the latter case, the Arduino hardware board acts as a host that sends the sensor data while the Android device acts as a client that accepts this data over the TCP/IP network and displays the data on the application dashboard.