Analyze Data from Multiple Simulations
You can analyze data from multiple simulations by viewing the data from each simulation using the same visualizations and subplot layout. With the Simulation Data Inspector, you can save the subplot layout and configuration, including the plotted signal selection, as a view in an MLDATX file that you can load to visualize data from another simulation. When the Simulation Data Inspector contains multiple runs, you can also copy or cut the plotted signal selection from one run and then paste it onto another to plot data from different runs side by side or easily swap which run supplies the data for the plots.
This example shows how to use views and the cut, copy, and paste options in the Simulation
Data Inspector to analyze data from several simulations of the model
sldemo_autotrans. For information about analyzing simulation data using
comparisons, see Compare Simulation Data.
Open and Simulate the Model
Open the model sldemo_autotrans, which models a controller for an automatic transmission system. The model uses a Signal Editor block to load external input data to model the Throttle and Brake signals for different vehicle maneuvers. In this example, you run several simulations and analyze the system response to different vehicle maneuvers. For more information about the model and the system it represents, see Model an Automatic Transmission Controller.
open_system('sldemo_autotrans');Simulate the model for the default input scenario, which represents a passing maneuver. On the Simulation tab, click Run.
Create and Save Views to Analyze Simulation Results
After simulating the model, analyze the simulation results by plotting signals on
multiple time plots in the Simulation Data Inspector. For example, visualize the input
signals Throttle and Brake alongside the
EngineRPM and VehicleSpeed signals to see how the
driver input to the vehicle affects the vehicle speed.
Open the Simulation Data Inspector. On the Simulation tab, under
Review Results, click Data Inspector. Then,
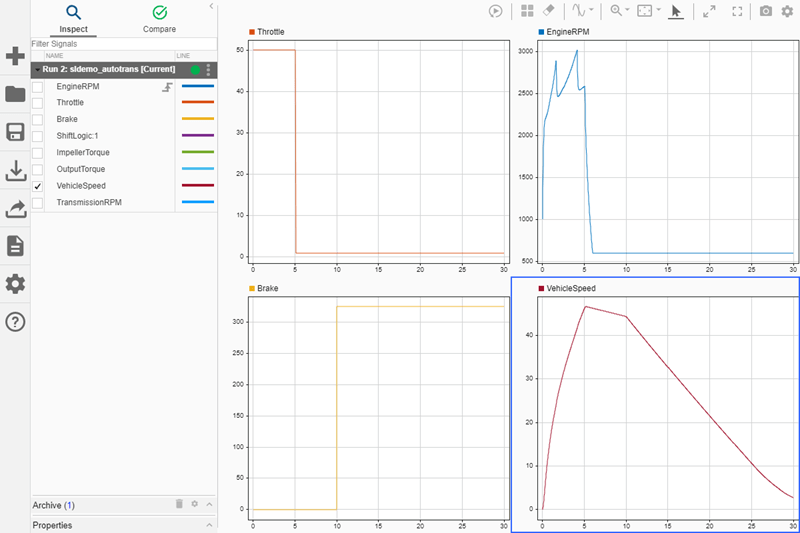
change the subplot layout in the Simulation Data Inspector to include four subplots, one for
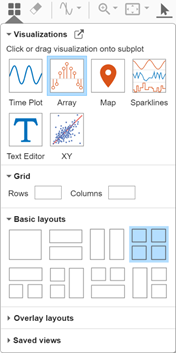
each signal. To change the subplot layout, click Visualizations and layouts
![]() . Then, under Basic Layouts, select the
four-subplot layout.
. Then, under Basic Layouts, select the
four-subplot layout.
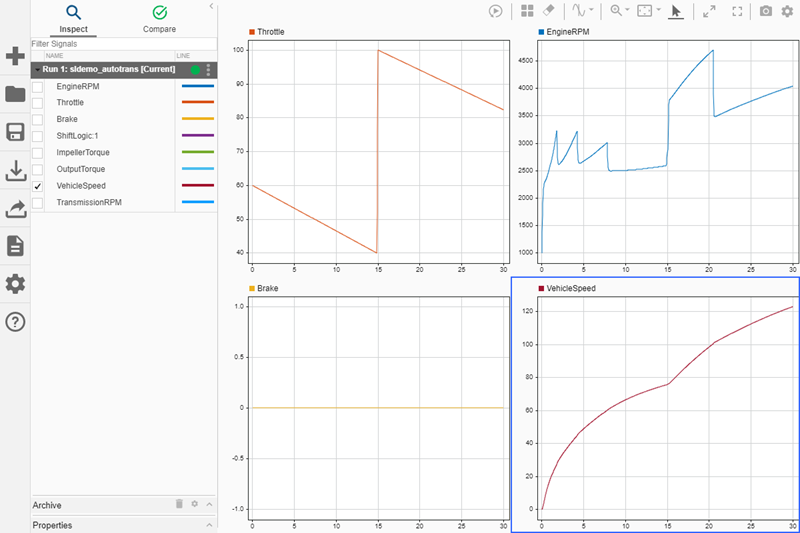
Plot the Throttle signal on the top-left subplot. To plot the signal,
select the subplot where you want to plot the signal, then select the check box next to the
signal. Plot the Brake signal on the subplot below the
Throttle signal, then plot the EngineRPM and
VehicleSpeed signals on the remaining subplots.
To facilitate building the same visualization for subsequent simulations, save the view.
In the Simulation Data Inspector, click Layout, then select Save current
view. Use the dialog box to specify a name for the view and browse to the
location where you want to save the view file. Alternatively, you can save the view
programmatically using the Simulink.sdi.saveView function. This example saves the view with the name
ThrottleBrakeVehicleSpeed.
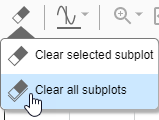
After saving the view, clear the subplots so you can visualize another set of signals. Click Clear Subplot, then select Clear all subplots.
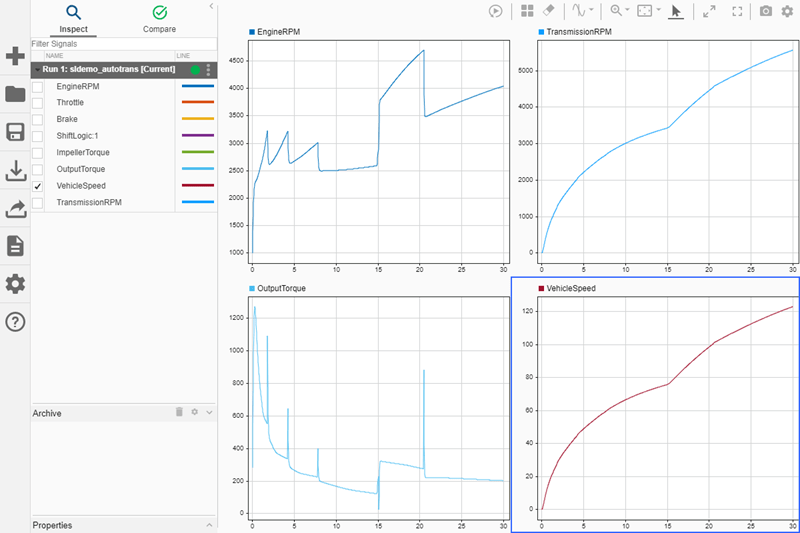
Build another view to analyze the relationships among the EngineRPM,
OutputTorque, TransmissionRPM, and
VehicleSpeed signals.
Save the view using the Simulink.sdi.saveView function or using the
Simulation Data Inspector UI. In the Simulation Data Inspector, click Layout, then select
Save current view. This example saves the view with the name
RPMTorqueVehicleSpeed.
Load a View and Plot Signals Side by Side
Simulate the model again, using input data for the hard braking vehicle maneuver. To
change the input scenario the Signal Editor block loads, double-click the
ManeuversGUI block. Then, from the Active scenario
list, select the Hard_braking scenario.
By default, when you simulate the model the second time, the Simulation Data Inspector
updates the plots in the current view with data from the current simulation and moves the
prior simulation run into the archive. To better understand the vehicle maneuver, load the
first view that plots the Throttle and Brake signals
using the Simulation Data Inspector or the Simulink.sdi.loadView function. To load the view using the Simulation Data
Inspector UI:
Click Layout, then select Open saved view.
In the dialog box, select
ThrottleBrakeVehicleSpeed.mldatx.Click Open.
To adjust the zoom level for the signals from the new run, click Fit to View
![]() or press the space bar.
or press the space bar.
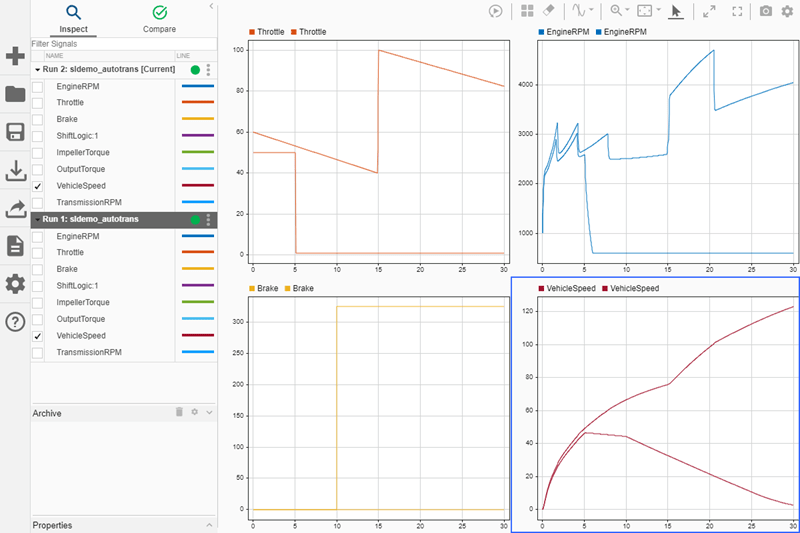
Analyze the differences between the passing maneuver and hard braking maneuver by plotting the same signals from each simulation side by side. Copy the plotted signal selection for the current run and paste it onto the prior run in the archive.
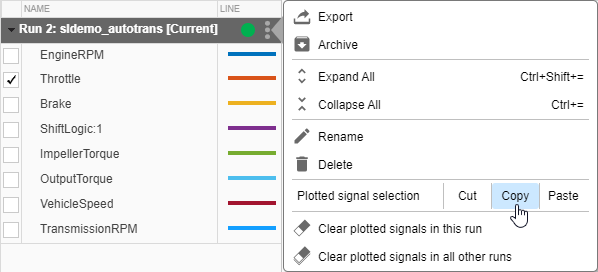
To open the run actions menu for the current run, click the three dots on the right of the row for the current run. Then, under Plotted signal selection, select Copy.
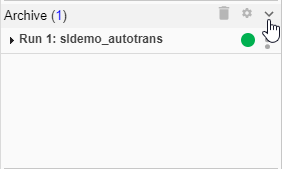
Click the arrow to expand the archive and access the prior run.
To open the run actions menu for the prior run, click the three dots on the right of the row for the prior run in the archive. Then, under Plotted signal selection, select Paste.
The cut, copy, and paste options work for all visualizations that plot signal data, including XY plots and Maps.
Note
The map visualization only supports displaying one route. When you copy and paste the plotted signals selection for a view that includes a map, the map updates to display the route from the run where you pasted the plotted signal selection.
Analyze the differences between the passing maneuver and hard braking simulations using the second view.
Load the view
RPMTorqueVehicleSpeed.mldatx.Click Layout, then select Open saved view. Select the file
RPMTorqueVehicleSpeed.mldatxand click Open.Click Fit to View
 or press the space bar.
Copy the plotted signal selection from the current run.
Paste the plotted signal selection from the current run onto the first run.

Swap Source Run for Plotted Signals
Simulate the model again, using input data for the gradual acceleration maneuver. To
change the input scenario the Signal Editor block loads, double-click the
ManeuversGUI block. Then, from the Active scenario
list, select the Gradual_Acceleration scenario.
When you simulate the model again, the plots update to display data from the current
run. To analyze the vehicle maneuver, load the first view. Click Layout, then select
Open saved view and select the
ThrottleBrakeVehicleSpeed view file. To adjust the axis limits for the
new run data, click Fit to View ![]() or press the space bar.
or press the space bar.
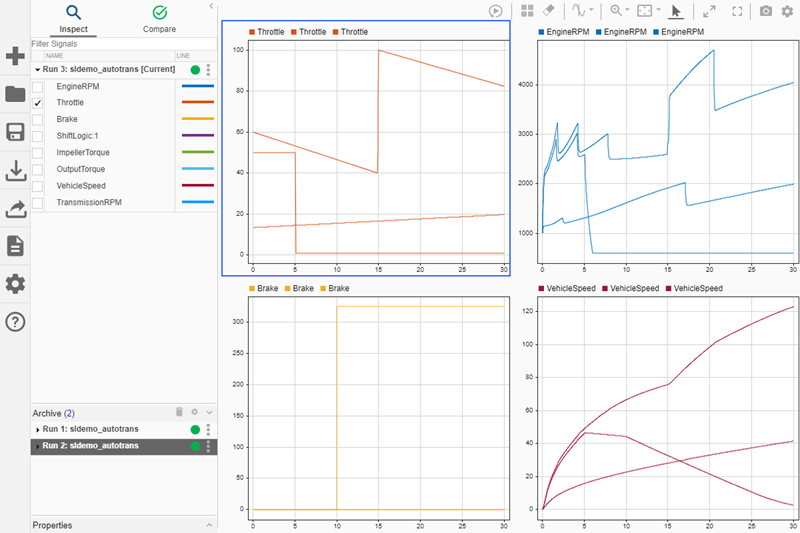
Suppose you want to view data from all three runs together. You can copy the plotted signal selection from the current run and paste it onto both prior runs.
Open the run actions menu for the current run. Then, under Plotted signal selection, select Copy.
Open the run actions menu for Run 1 in the archive. Then, under Plotted signal selection, select Paste.
Open the run actions menu for Run 2 in the archive. Then, under Plotted signal selection, select Paste.
Now suppose you want to analyze each vehicle maneuver on its own. Using the run actions menu, you can easily clear signals from a specific run from the view or clear signals from all runs except a specific run from the view. Then, you can use the cut and paste options to swap which run provides the data for the view.
To remove signals from the passing maneuver and hard braking maneuver simulations, open the run actions menu for the current run and select Clear plotted signals in all other runs.
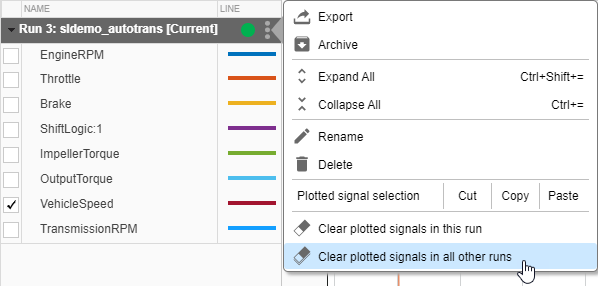
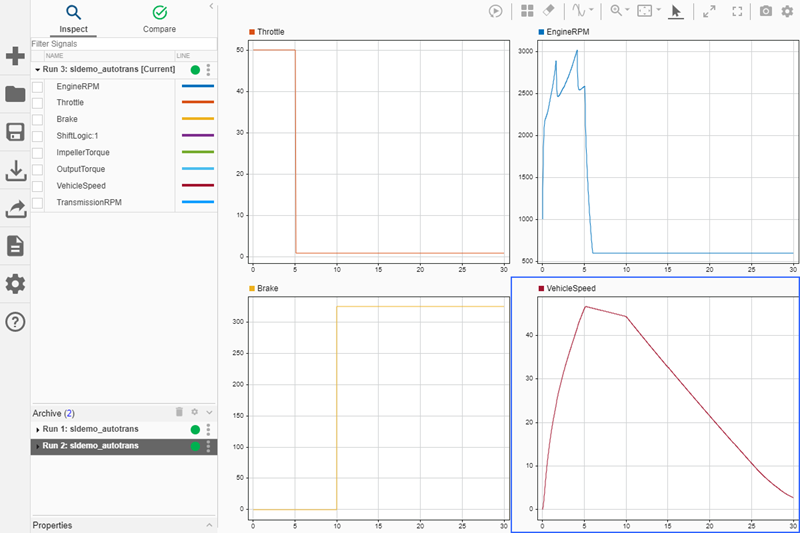
Only signals from the current run remain plotted.

To update the view to plot only signals from the hard braking maneuver simulation, cut the plotted signal selection from the current run and paste it onto Run 2 in the archive.
Open the run actions menu for the current run. Then, under Plotted signal selection, select Cut.
Open the run actions menu for Run 2. Then, under Plotted signal selection, select Paste.
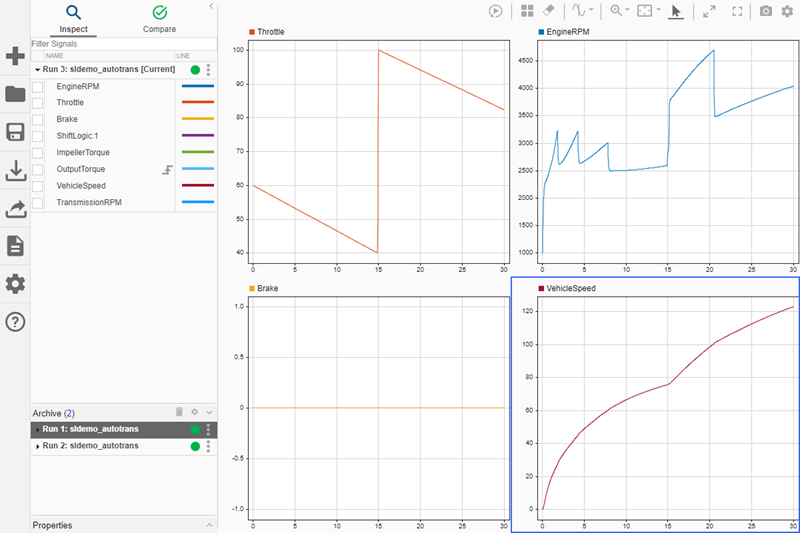
To update the view to plot only signals from the passing maneuver simulation, cut the plotted signal selection from Run 2 and paste it onto Run 1.
Open the run actions menu for Run 2. Then, under Plotted signal selection, select Cut.
Open the run actions menu for Run 1. Then, under Plotted signal selection, select Paste.
You can repeat similar steps using the other view,
RPMTorqueVehicleSpeed. Load the view using the
Simulink.sdi.loadView function or by clicking Layout and then
selecting Open saved view. Then, use the run actions menu to plot
signals from each run side by side or on their own.
See Also
Simulink.sdi.loadView | Simulink.sdi.saveView