Debug Simulation Using Signal Breakpoints
This example shows how to:
Pause simulation at a specified time.
View signal values in the block diagram using port value labels.
Pause simulation at points of interest using signal breakpoints.
Step through time steps block by block.
View the execution order in the block diagram.
You can also step through a simulation from the beginning. For an example that shows how to step a simulation from the start and configure options for stepping through time steps and stepping back, see Step Through Simulations Using the Simulink Editor.
Open Model and Set Up Debugging Tools
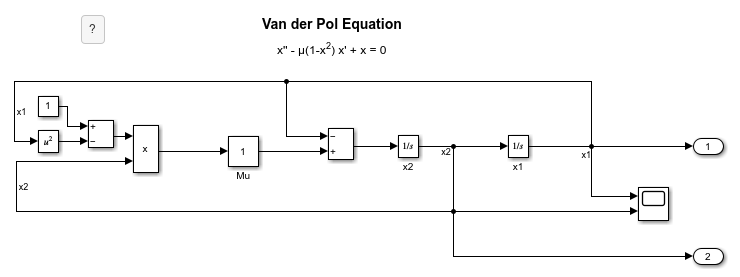
Open the model vdp, which implements the Van der Pol equation. For more information about the model, see Van der Pol Oscillator.
openExample("simulink_general/VanDerPolOscillatorExample",...
    supportingFile="vdp")
Before starting the simulation, set up the relevant debugging tools.
To step through time steps block by block, check that the simulation mode is set to
Normalin the model and that low-level debugging is enabled.In the Simulink® Toolstrip:
On the Simulation tab or the Debug tab, in the Simulate section, check that the Simulation mode list selection is
Normal.On the Debug tab, in the Breakpoints section, click Breakpoints List. In the Breakpoints List, check that Pause within time step is selected.
To save time in iterative debugging simulations, enable fast restart.
In the Simulink Toolstrip, on the Simulation tab, click Fast Restart.
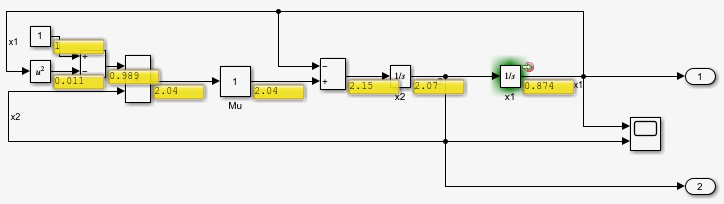
To view signal values in the block diagram as you step through the simulation, add port value labels.
Click an empty area in the upper left of the canvas and drag to select everything in the block diagram. Then, on the Debug tab, in the Tools section, in the Port Values button group, click Show port value label on selected signal
 . After you add the port value labels, each signal shows
 no data yetuntil the simulation advances to a point that provides a new value to the port value label.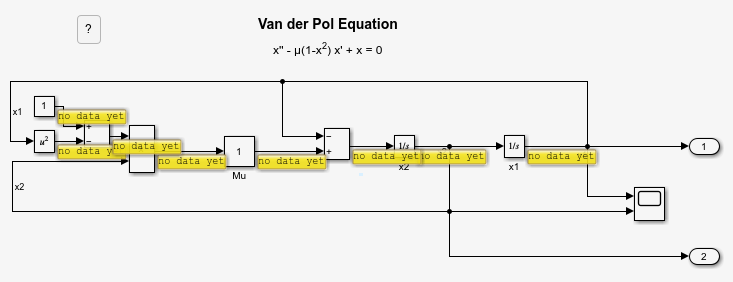
To view the execution order while stepping block by block, open the Execution Order viewer.
In the Breakpoints List, click Open the Execution Order Viewer
 .
.
Tip
To enable stepping into MATLAB Function blocks and Stateflow® charts, select Allow setting breakpoints during simulation before starting a debugging simulation.
Pause Simulation at Specified Time
Suppose you know you need to analyze the behavior of your model around a certain time in the simulation. You can run the simulation without interruption up to the time you specify as the Pause Time. For this example, pause after the simulation runs for 2 seconds.
In the Simulink Toolstrip, on the Debug tab, in the
Breakpoints section, specify the Pause
Time as 2. Then, to start the simulation, click
Run.
Because this simulation is the first after enabling fast restart for this model,
the model compiles before starting the simulation. Then, the simulation pauses after
computing values for the time step that happens at a simulation time of
2.079 seconds.
To monitor the simulation status and simulation time, use the status bar at the bottom of the Simulink Editor. While the simulation is paused, the progress bar indicates the simulation status. The status bar shows the simulation time of the time step that most recently computed output values. The asterisk on the simulation time indicates that the simulation time in the internal state of the simulation is ahead of the time displayed in the status bar.
![]()
When you specify a pause time, the simulation does not necessarily pause at that exact time. The solver determines the time steps the simulation takes, and the simulation might not have a time hit at the exact time you specify. Instead, the simulation pauses at the end the first time step that occurs at or after the time that you specify.
Step Through Time Steps
While paused in simulation, you can use the Step Forward and Step Back buttons to step the simulation through time steps. Before you can step back, you must enable stepping back. You can also configure the number of time steps to advance the simulation each time you click Step Forward or Step Back. For more information, see Step Through Simulations Using the Simulink Editor.
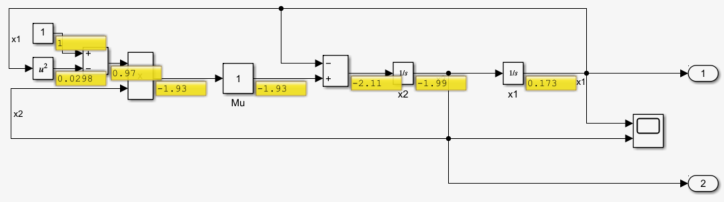
Click Step Forward. The simulation advances forward by one time step and pauses after computing values for the time step. The port value labels update to display the signal values from the time step.

You can continue advancing the simulation by clicking Step Forward. As the simulation progresses, you can observe the signal values using the port value labels and the Scope block in the model.
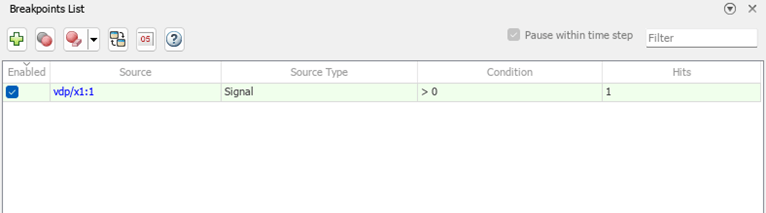
Pause Simulation Using Signal Breakpoints
You can use signal breakpoints to pause the simulation each time a signal value satisfies a specified condition. When you use signal breakpoints, by default, the simulation pauses within the time step as soon as the condition is met, just after the block that produces the signal runs its output method to update the signal value.
You can control whether the simulation pauses within the time step when the condition is met or at the end of the time step in which the condition is met in the Breakpoints List. When you clear Pause within time step in the Breakpoints List, the simulation pauses at the end of the time step in which the condition is met. For more information, see Breakpoints List.
Suppose you want to investigate the behavior of the model when the value of the
signal x1 is close to zero. Specify the condition for the
breakpoint as > 0. You could also configure the condition using
the equal (==) relational operator. However, in that case, the
breakpoint pauses the simulation only when the signal has exactly that value. The
solver might choose time steps where the signal value is close to zero but not
exactly zero. The signal breakpoint with the condition > 0 pauses
the simulation each time the signal value is greater than 0.
To set the signal breakpoint:
Select the signal
x1.On the Debug tab, in the Breakpoints section, click Add Breakpoint.
In the Add Breakpoint dialog box, select a relational operator to define the condition for the signal breakpoint. For this example, select greater than
>.Specify the value for the breakpoint condition as
0so that the simulation pauses when the value of the signalx1is greater than zero.Click OK.
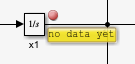
A red circle on the line for the signal x1 indicates that the
signal has an enabled breakpoint.

By default, clicking a signal line during simulation adds or removes the port
value label for the line. To add the port value label for the signal
x1, click the signal line again. The port value label
displays no data yet because when you remove a port value label,
the software does not retain a history of signal values. The port value label
updates to display the signal value the next time the simulation advances
forward.
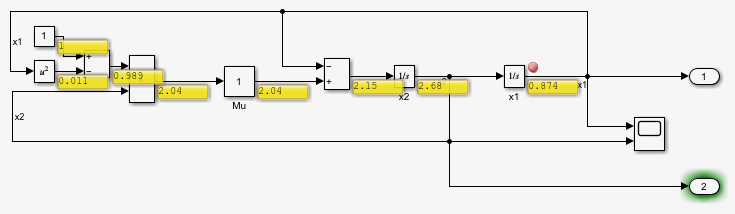
To advance the simulation until the breakpoint is hit, click Continue. The simulation pauses when the signal value becomes greater than zero. When the simulation pauses on the breakpoint within the time step:
The Execution Order viewer annotates the block diagram for the task in which the simulation pauses and displays the execution order for that task as a list.
The port value label for the signal
x1shows the signal value that satisfied the breakpoint condition.The green arrow on the breakpoint icon indicates that the breakpoint caused the simulation to pause.
The green highlight on the block that produces the signal
x1indicates where the simulation is paused within the time step.
The left side of the status bar provides a detailed simulation status that indicates where the simulation is paused.
![]()
When the simulation is paused on a breakpoint, you can open the Breakpoints
List by clicking Open Breakpoints List ![]() near the middle of the status bar.
near the middle of the status bar.
The green highlight in the Breakpoints List indicates that the simulation is paused on the breakpoint.
Step Block by Block
To analyze how each block computes its output value within a time step, you can advance the simulation block by block. To advance the simulation past the breakpoint and pause just before the next block executes, click Step Over. The simulation pauses on the next block, the Outport block with a port index of 1. The green arrow no longer appears on the breakpoint.

The next time you click Step Over, the simulation pauses just
before executing the Integrator block named x2.
When you click Step Over once more, the
Integrator block named x2 executes to produce
an output value, the port value label updates to display the new signal value, and
the simulation pauses just before executing the Outport block with a
port index of 2.
Note
While paused within a time step, you can use some functions from the sldebug programmatic interface to get additional information about the
simulation. For example, you could use the probe function to view
information about a specified block. The values displayed by functions in the
sldebug programmatic interface might be different from the values
displayed by port value labels. The functions in the sldebug
programmatic interface display values computed for both minor time steps and major time
steps. Port value labels display values for only major time steps. For more information, see
Simulink Debugging Programmatic Interface.
You can continue stepping the simulation one block at a time through multiple time steps. If you click Step Forward or Step Back, only the Step Over button remains enabled to allow you to resume stepping within a time step, block by block.
Before R2024a: If you click Step Forward or Step Back, the simulation pauses between time steps, and the Step Over, Step In, and Step Out buttons are disabled. The Step Over, Step In, and Step Out buttons are enabled again when the simulation pauses on a breakpoint.
End Simulation Debugging Session
When you are done analyzing and debugging your model, you can end the simulation debugging session in one of several ways, depending on what you plan to do next.
To continue the simulation from the current time point and retain the set of breakpoints configured in the model, disable all breakpoints.
To open the Breakpoints List, on the Debug tab, click Breakpoints List.
In the Breakpoints List, use the check boxes in the Enable column or the Enable or disable all breakpoints button to disable all the breakpoints.
To resume the simulation, click Continue.
To continue the simulation from the current time point without retaining breakpoints, remove all breakpoints from the model.
To clear all breakpoints in the model, on the Debug tab, click the Add Breakpoint button arrow and select Clear All Breakpoints.
To resume simulation, click Continue.
To stop the simulation at the current time point, in the Simulink Toolstrip, on the Debug tab, click Stop.
See Also
Simulation Stepping Options | Breakpoints List