Trace Connections and Author Ports Using Component Interface View
This example shows how you can use the Component Interface View to trace connections and author ports.
When you build large model hierarchies, the Component Interface View can help you:
Identify input and output ports.
Trace the usage of a signal, bus, or message from a port to its source and termination.
Author input and output ports.
Edit types and assign types to ports.
The Component Interface View also supports the same interactions as the Simulink® Editor. For example, you can edit block diagrams and display information overlays such as sample time.
Open Example
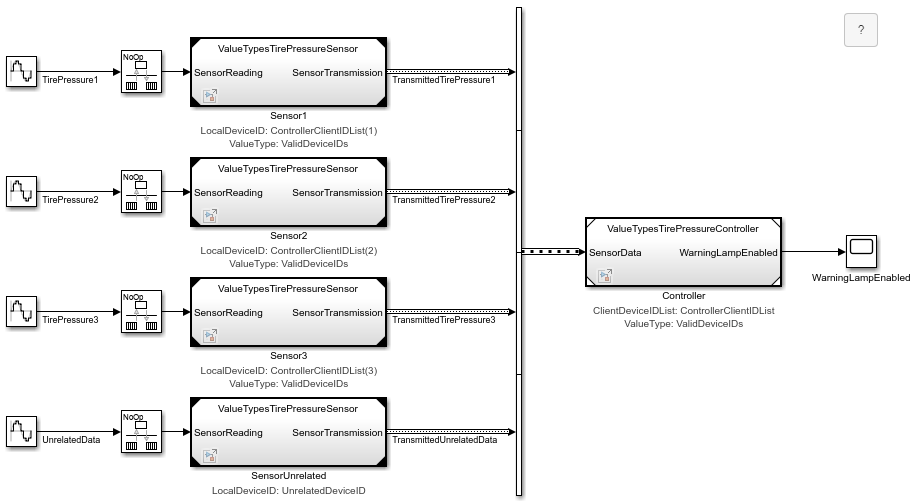
The ValueTypesTirePressure project defines a model hierarchy that determines whether the tire pressures of a three-wheeled vehicle are within the intended operating range. Each sensor transmits tire pressure data mapped to a unique sensor ID. Of the four sensors in the model, only three measure the tire pressure of the target vehicle. A controller filters out the unrelated sensor and determines whether the vehicle tire pressures are acceptable. When a tire pressure is out of range, the controller enables a warning lamp.
To open the project and top model, open the example. To update the line styles and load the referenced models, compile the model. In the Simulink Toolstrip, on the Modeling tab, click Update Model or Run.
Inspect Component Interface
To inspect the interfaces of the model components, open the Component Interface View. On the Modeling tab, in the Design gallery, click Interface View. Alternatively, press Ctrl+Shift+V.
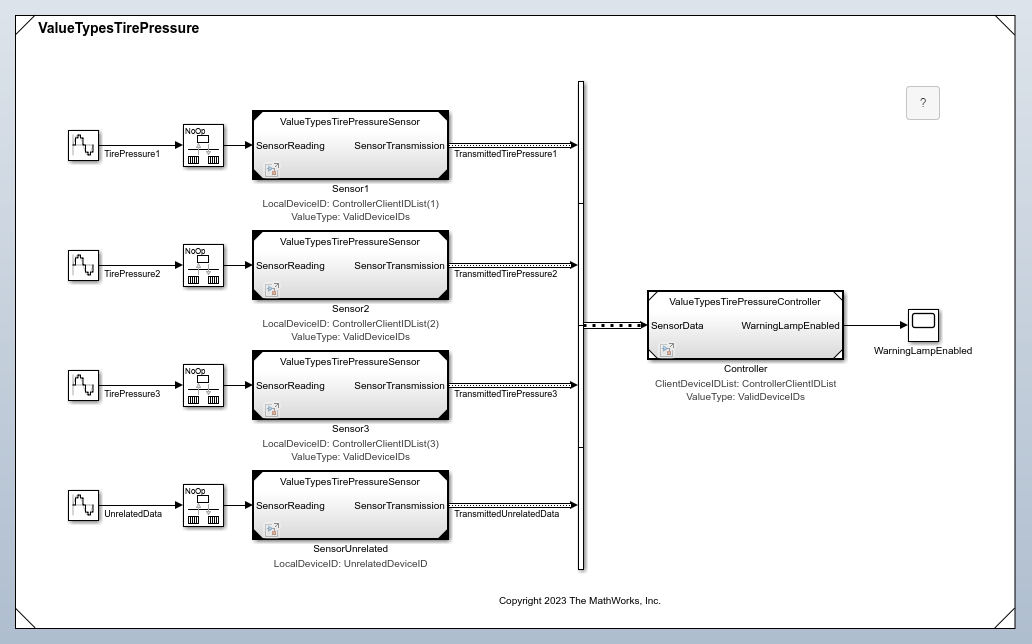
The Component Interface View displays the boundary of the component with corners that indicate the component type.
Triangles in four corners — Model, regardless of whether the model is a top model or referenced model
Triangles in two corners — Referenced subsystem, which is saved in a subsystem file
Plain corners — Subsystem that is saved in the parent model file
The Component Interface View also displays input and output ports on the component boundary. However, the top model in this example has no input or output ports.
Identify Input and Output Ports
Navigate into the referenced model named ValueTypesTirePressureSensor by double-clicking one of the Model blocks that references the model, such as the Model block named Sensor1.
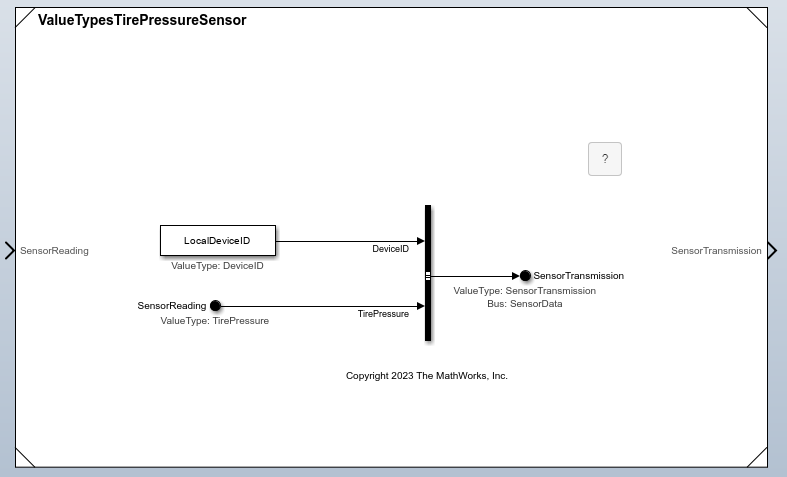
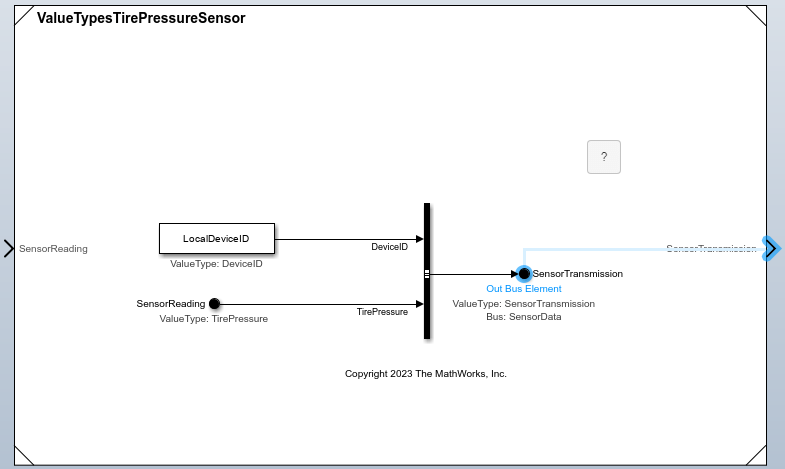
The referenced model has an input port named SensorReading and an output port named SensorTransmission. The Component Interface View displays these ports on the component boundary.
To trace a port to the blocks that represent the port, select the port. For example, select the output port. The Component Interface View selects the corresponding block and displays the relationship between the port and the block with a line.
Trace Port Usage
To trace the signal, bus, or message at a port, select the port. Then, click Show usage.

The Property Inspector opens. The Component Interface View traces the usage of the top-level bus, signal, or message that the port receives. In this example, the output port receives a bus.
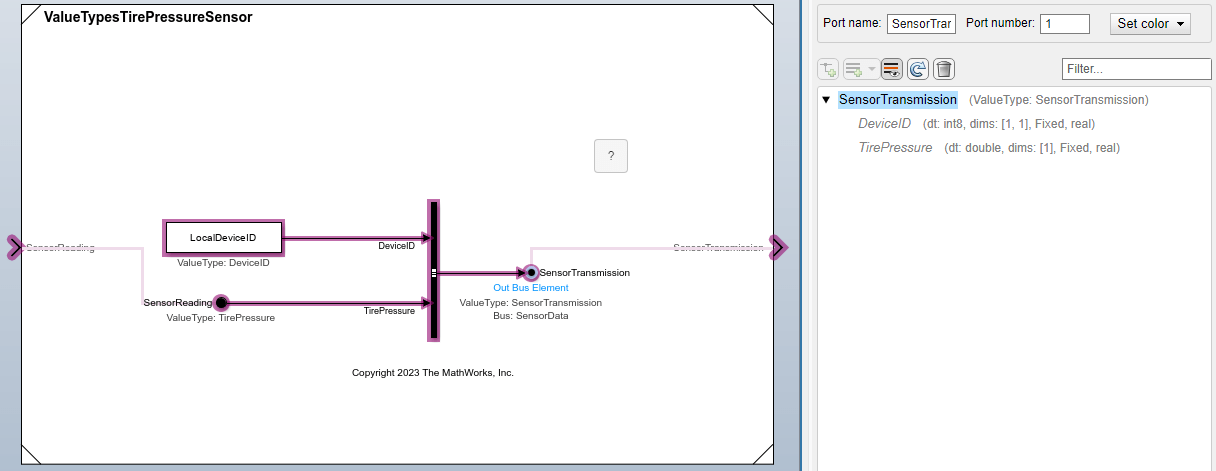
To trace the usage of a bus element, in the Property Inspector, select the element. For example, select TirePressure.
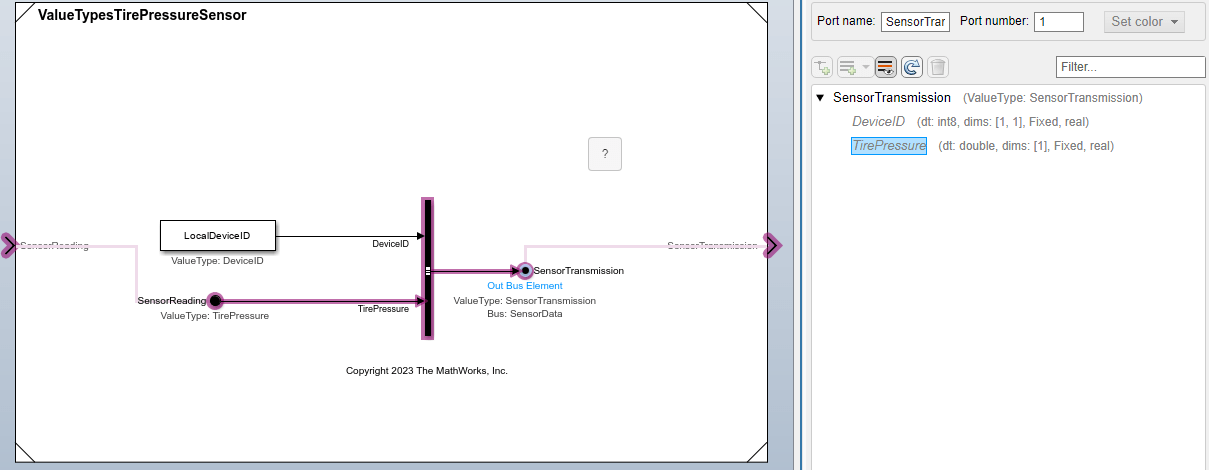
The Component Interface View traces the usage of TirePressure from the output port to the input port.
The Component Interface View also traces usage through subsystem boundaries. Open the referenced model named ValueTypesTirePressureController by double-clicking the Model block named Controller at the top level of the model hierarchy. Then, select the input port named SensorData and click Show usage.
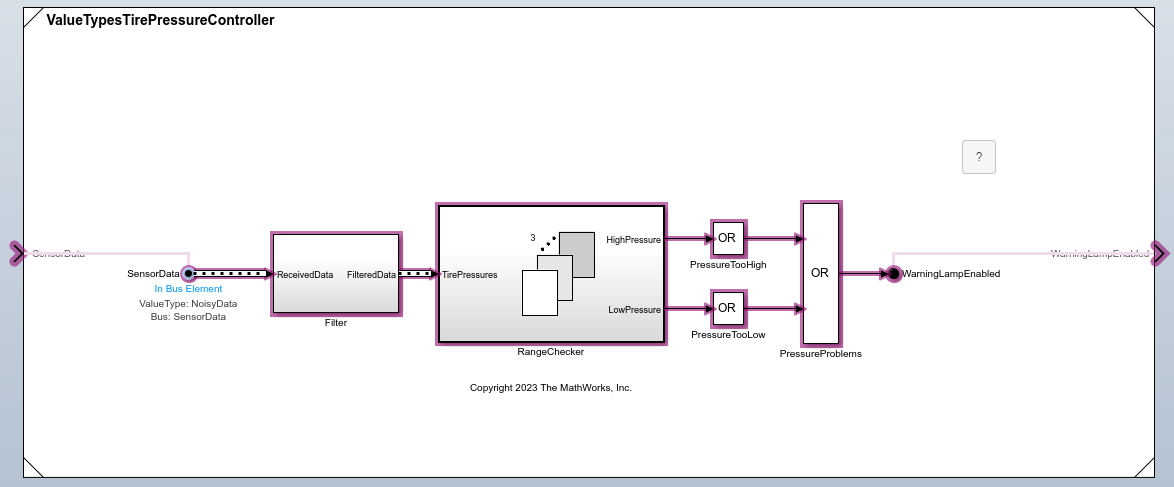
To see how the subsystem named RangeChecker uses the input from SensorData, double-click the Subsystem block.
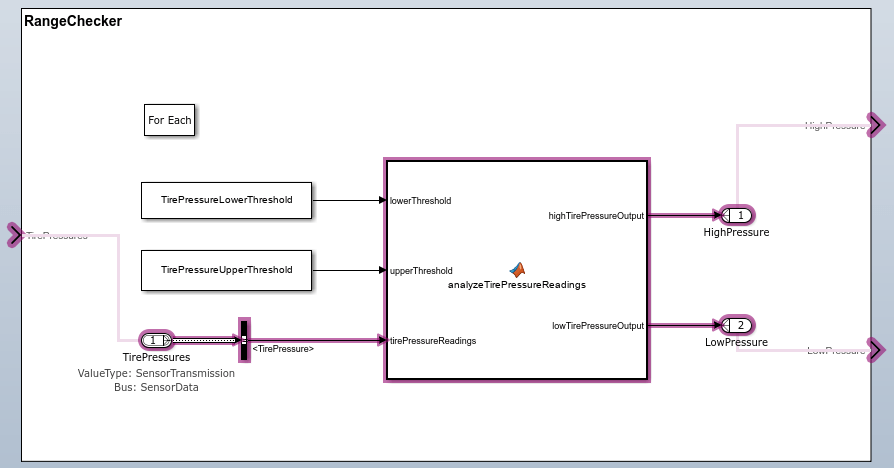
The Component Interface View traces the bus usage through the subsystem.
Author Ports
Suppose you are developing the referenced model named ValueTypesTirePressureController from the bottom up.
Open a new model. Then, open the Component Interface View.
To view port authoring options, click the component boundary. Then, select an option to create a port. For example, create an input port by selecting Input.

The Component Interface View adds a port and a block that represents the port.

Double-click either instance of InBus and enter SensorData.
![]()
The port name updates in both places.
Edit Types
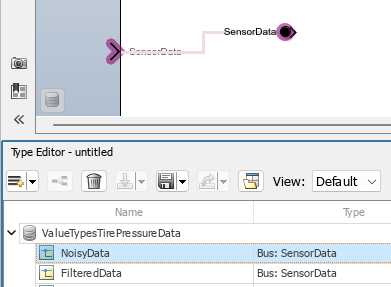
To begin editing port data types, select a port. For example, select the new SensorData port. Then, click Edit types.
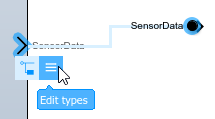
The docked Type Editor opens.
To open a data dictionary, click ![]() . In the Model Properties window, specify the data dictionary. For this example, specify
. In the Model Properties window, specify the data dictionary. For this example, specify ValueTypesTirePressureData.sldd.
In the Type Editor, expand the data dictionary. Optionally, add and edit types.
To apply the value type named NoisyData to the port named SensorData, in the Type Editor, right-click NoisyData. Then, click Assign type to selected blocks and ports.
The Type Editor highlights the ports and blocks that use the NoisyData value type.
